Cuban vs South African Poverty
COMPARE
Cuban
South African
Poverty
Poverty Comparison
Cubans
South Africans
13.9%
POVERTY
0.6/ 100
METRIC RATING
235th/ 347
METRIC RANK
11.7%
POVERTY
87.0/ 100
METRIC RATING
129th/ 347
METRIC RANK
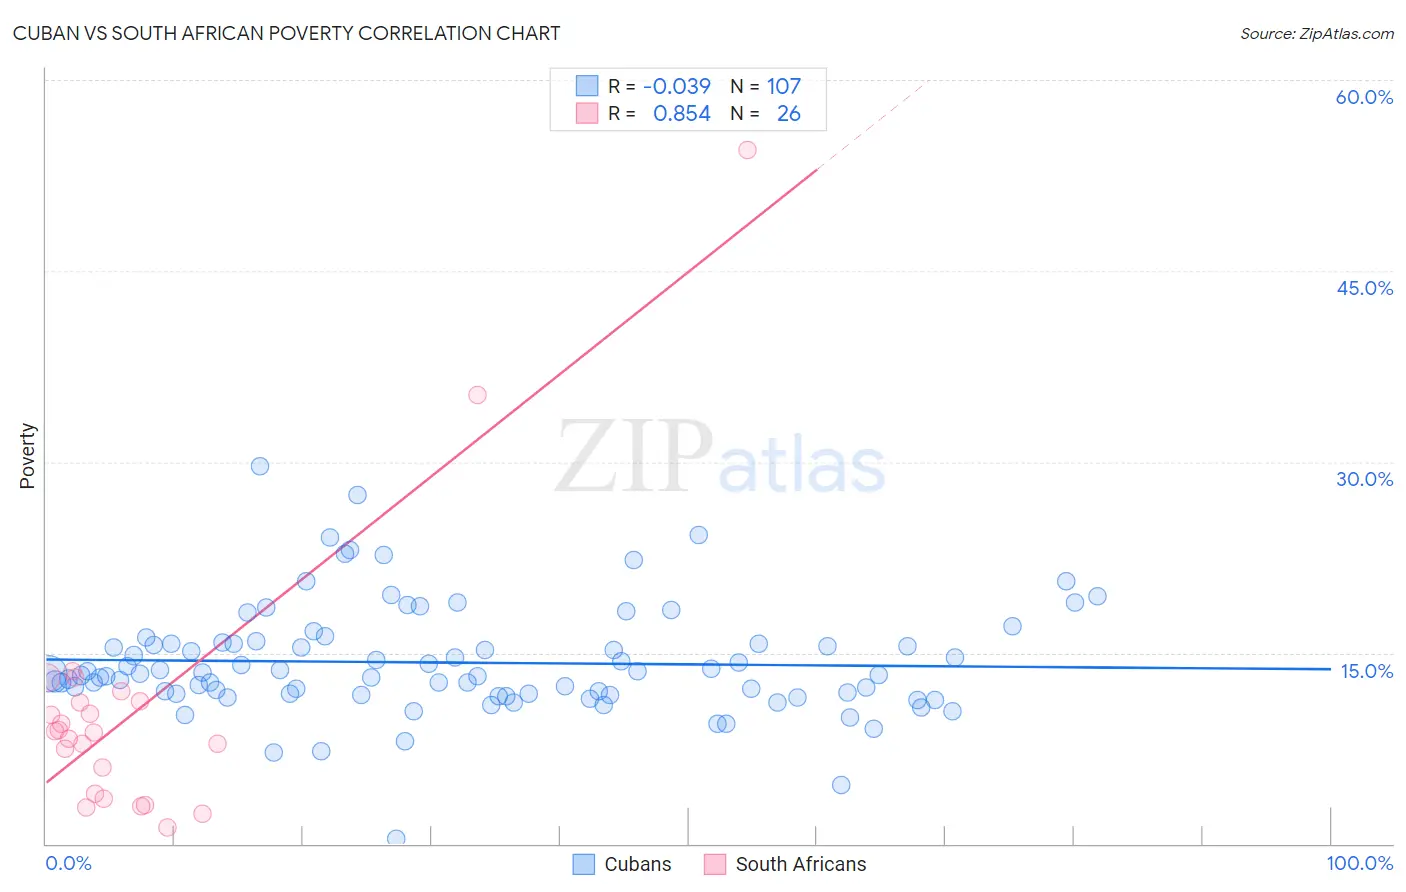
Cuban vs South African Poverty Correlation Chart
The statistical analysis conducted on geographies consisting of 448,978,860 people shows no correlation between the proportion of Cubans and poverty level in the United States with a correlation coefficient (R) of -0.039 and weighted average of 13.9%. Similarly, the statistical analysis conducted on geographies consisting of 182,558,592 people shows a very strong positive correlation between the proportion of South Africans and poverty level in the United States with a correlation coefficient (R) of 0.854 and weighted average of 11.7%, a difference of 18.0%.
Poverty Correlation Summary
| Measurement | Cuban | South African |
| Minimum | 0.38% | 1.3% |
| Maximum | 29.6% | 54.5% |
| Range | 29.3% | 53.2% |
| Mean | 14.2% | 10.7% |
| Median | 13.3% | 8.8% |
| Interquartile 25% (IQ1) | 11.8% | 3.9% |
| Interquartile 75% (IQ3) | 15.7% | 11.2% |
| Interquartile Range (IQR) | 4.0% | 7.2% |
| Standard Deviation (Sample) | 4.3% | 11.0% |
| Standard Deviation (Population) | 4.3% | 10.8% |
Similar Demographics by Poverty
Demographics Similar to Cubans by Poverty
In terms of poverty, the demographic groups most similar to Cubans are Immigrants from Armenia (13.9%, a difference of 0.040%), French American Indian (13.9%, a difference of 0.060%), Ghanaian (13.9%, a difference of 0.19%), Immigrants from Laos (13.8%, a difference of 0.44%), and Nicaraguan (13.9%, a difference of 0.54%).
| Demographics | Rating | Rank | Poverty |
| Immigrants | Nigeria | 1.7 /100 | #228 | Tragic 13.5% |
| Osage | 1.5 /100 | #229 | Tragic 13.6% |
| Alaskan Athabascans | 1.5 /100 | #230 | Tragic 13.6% |
| Nigerians | 1.4 /100 | #231 | Tragic 13.6% |
| Fijians | 0.8 /100 | #232 | Tragic 13.7% |
| Immigrants | Saudi Arabia | 0.8 /100 | #233 | Tragic 13.8% |
| Immigrants | Laos | 0.7 /100 | #234 | Tragic 13.8% |
| Cubans | 0.6 /100 | #235 | Tragic 13.9% |
| Immigrants | Armenia | 0.5 /100 | #236 | Tragic 13.9% |
| French American Indians | 0.5 /100 | #237 | Tragic 13.9% |
| Ghanaians | 0.5 /100 | #238 | Tragic 13.9% |
| Nicaraguans | 0.4 /100 | #239 | Tragic 13.9% |
| Immigrants | Middle Africa | 0.4 /100 | #240 | Tragic 14.0% |
| Salvadorans | 0.4 /100 | #241 | Tragic 14.0% |
| Ecuadorians | 0.4 /100 | #242 | Tragic 14.0% |
Demographics Similar to South Africans by Poverty
In terms of poverty, the demographic groups most similar to South Africans are Immigrants from Israel (11.7%, a difference of 0.090%), Immigrants from Ukraine (11.8%, a difference of 0.090%), French (11.8%, a difference of 0.19%), Immigrants from Argentina (11.7%, a difference of 0.22%), and Immigrants from Norway (11.7%, a difference of 0.24%).
| Demographics | Rating | Rank | Poverty |
| Puget Sound Salish | 88.7 /100 | #122 | Excellent 11.7% |
| Immigrants | Hungary | 88.6 /100 | #123 | Excellent 11.7% |
| Soviet Union | 88.4 /100 | #124 | Excellent 11.7% |
| Immigrants | Brazil | 88.2 /100 | #125 | Excellent 11.7% |
| Immigrants | Norway | 88.0 /100 | #126 | Excellent 11.7% |
| Immigrants | Argentina | 88.0 /100 | #127 | Excellent 11.7% |
| Immigrants | Israel | 87.4 /100 | #128 | Excellent 11.7% |
| South Africans | 87.0 /100 | #129 | Excellent 11.7% |
| Immigrants | Ukraine | 86.6 /100 | #130 | Excellent 11.8% |
| French | 86.1 /100 | #131 | Excellent 11.8% |
| Peruvians | 85.6 /100 | #132 | Excellent 11.8% |
| Immigrants | Western Europe | 85.2 /100 | #133 | Excellent 11.8% |
| Yugoslavians | 85.2 /100 | #134 | Excellent 11.8% |
| Immigrants | Vietnam | 85.2 /100 | #135 | Excellent 11.8% |
| Chileans | 84.2 /100 | #136 | Excellent 11.8% |