Cuban vs South African Female Disability
COMPARE
Cuban
South African
Female Disability
Female Disability Comparison
Cubans
South Africans
12.3%
FEMALE DISABILITY
36.5/ 100
METRIC RATING
183rd/ 347
METRIC RANK
11.8%
FEMALE DISABILITY
97.7/ 100
METRIC RATING
114th/ 347
METRIC RANK
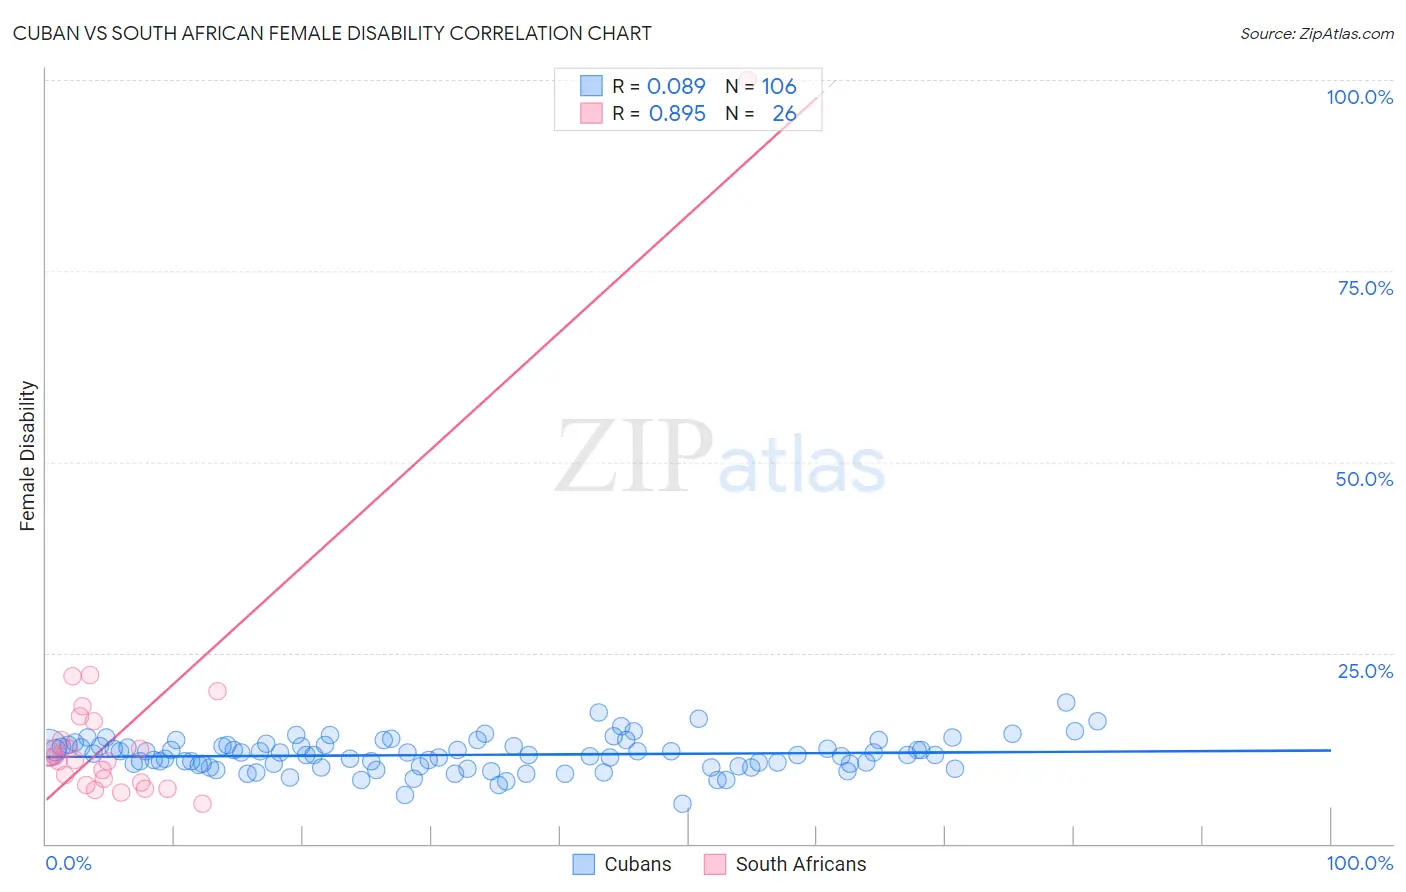
Cuban vs South African Female Disability Correlation Chart
The statistical analysis conducted on geographies consisting of 449,245,212 people shows a slight positive correlation between the proportion of Cubans and percentage of females with a disability in the United States with a correlation coefficient (R) of 0.089 and weighted average of 12.3%. Similarly, the statistical analysis conducted on geographies consisting of 182,588,649 people shows a very strong positive correlation between the proportion of South Africans and percentage of females with a disability in the United States with a correlation coefficient (R) of 0.895 and weighted average of 11.8%, a difference of 4.2%.
Female Disability Correlation Summary
| Measurement | Cuban | South African |
| Minimum | 5.2% | 5.3% |
| Maximum | 18.5% | 100.0% |
| Range | 13.3% | 94.7% |
| Mean | 11.6% | 15.3% |
| Median | 11.7% | 11.1% |
| Interquartile 25% (IQ1) | 10.1% | 8.1% |
| Interquartile 75% (IQ3) | 12.8% | 16.1% |
| Interquartile Range (IQR) | 2.7% | 8.0% |
| Standard Deviation (Sample) | 2.1% | 17.9% |
| Standard Deviation (Population) | 2.1% | 17.6% |
Similar Demographics by Female Disability
Demographics Similar to Cubans by Female Disability
In terms of female disability, the demographic groups most similar to Cubans are Norwegian (12.3%, a difference of 0.020%), Iraqi (12.3%, a difference of 0.020%), Immigrants from Canada (12.3%, a difference of 0.030%), Albanian (12.3%, a difference of 0.060%), and Immigrants from Fiji (12.3%, a difference of 0.070%).
| Demographics | Rating | Rank | Female Disability |
| Immigrants | Guyana | 43.1 /100 | #176 | Average 12.2% |
| Immigrants | Ghana | 42.5 /100 | #177 | Average 12.2% |
| Immigrants | Western Europe | 40.9 /100 | #178 | Average 12.2% |
| Immigrants | Fiji | 38.2 /100 | #179 | Fair 12.3% |
| Albanians | 37.9 /100 | #180 | Fair 12.3% |
| Immigrants | Canada | 37.2 /100 | #181 | Fair 12.3% |
| Norwegians | 36.9 /100 | #182 | Fair 12.3% |
| Cubans | 36.5 /100 | #183 | Fair 12.3% |
| Iraqis | 36.0 /100 | #184 | Fair 12.3% |
| Immigrants | Uzbekistan | 33.9 /100 | #185 | Fair 12.3% |
| Austrians | 33.3 /100 | #186 | Fair 12.3% |
| Serbians | 33.1 /100 | #187 | Fair 12.3% |
| Immigrants | North America | 32.8 /100 | #188 | Fair 12.3% |
| Immigrants | Albania | 31.6 /100 | #189 | Fair 12.3% |
| Immigrants | Honduras | 31.3 /100 | #190 | Fair 12.3% |
Demographics Similar to South Africans by Female Disability
In terms of female disability, the demographic groups most similar to South Africans are Brazilian (11.8%, a difference of 0.0%), Immigrants from Belarus (11.8%, a difference of 0.030%), Immigrants from Bangladesh (11.8%, a difference of 0.040%), Immigrants from Morocco (11.8%, a difference of 0.050%), and Costa Rican (11.7%, a difference of 0.16%).
| Demographics | Rating | Rank | Female Disability |
| Latvians | 98.2 /100 | #107 | Exceptional 11.7% |
| New Zealanders | 98.1 /100 | #108 | Exceptional 11.7% |
| Immigrants | Immigrants | 98.1 /100 | #109 | Exceptional 11.7% |
| Soviet Union | 98.1 /100 | #110 | Exceptional 11.7% |
| Costa Ricans | 98.1 /100 | #111 | Exceptional 11.7% |
| Immigrants | Bangladesh | 97.8 /100 | #112 | Exceptional 11.8% |
| Immigrants | Belarus | 97.8 /100 | #113 | Exceptional 11.8% |
| South Africans | 97.7 /100 | #114 | Exceptional 11.8% |
| Brazilians | 97.7 /100 | #115 | Exceptional 11.8% |
| Immigrants | Morocco | 97.6 /100 | #116 | Exceptional 11.8% |
| Immigrants | Eastern Europe | 97.2 /100 | #117 | Exceptional 11.8% |
| Immigrants | Nigeria | 97.2 /100 | #118 | Exceptional 11.8% |
| Immigrants | Uganda | 97.2 /100 | #119 | Exceptional 11.8% |
| Immigrants | Kazakhstan | 97.0 /100 | #120 | Exceptional 11.8% |
| Immigrants | Netherlands | 96.9 /100 | #121 | Exceptional 11.8% |