Cuban vs South African Median Female Earnings
COMPARE
Cuban
South African
Median Female Earnings
Median Female Earnings Comparison
Cubans
South Africans
$34,942
MEDIAN FEMALE EARNINGS
0.0/ 100
METRIC RATING
313th/ 347
METRIC RANK
$41,825
MEDIAN FEMALE EARNINGS
98.8/ 100
METRIC RATING
96th/ 347
METRIC RANK
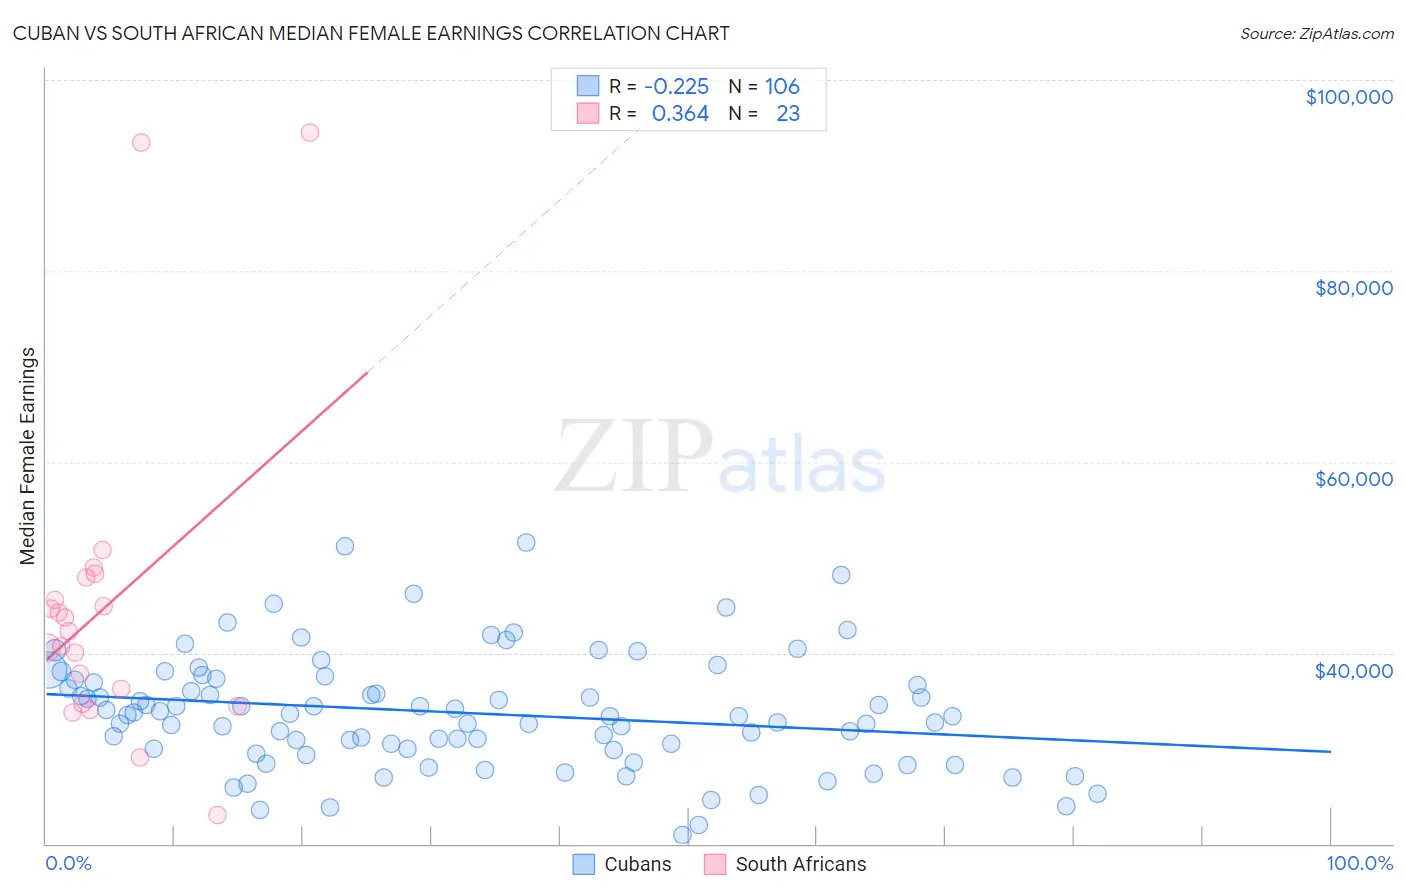
Cuban vs South African Median Female Earnings Correlation Chart
The statistical analysis conducted on geographies consisting of 449,056,362 people shows a weak negative correlation between the proportion of Cubans and median female earnings in the United States with a correlation coefficient (R) of -0.225 and weighted average of $34,942. Similarly, the statistical analysis conducted on geographies consisting of 182,555,636 people shows a mild positive correlation between the proportion of South Africans and median female earnings in the United States with a correlation coefficient (R) of 0.364 and weighted average of $41,825, a difference of 19.7%.
Median Female Earnings Correlation Summary
| Measurement | Cuban | South African |
| Minimum | $20,938 | $23,068 |
| Maximum | $51,542 | $94,510 |
| Range | $30,604 | $71,442 |
| Mean | $33,741 | $44,927 |
| Median | $33,424 | $42,310 |
| Interquartile 25% (IQ1) | $29,890 | $34,713 |
| Interquartile 75% (IQ3) | $37,174 | $47,886 |
| Interquartile Range (IQR) | $7,284 | $13,173 |
| Standard Deviation (Sample) | $5,986 | $16,884 |
| Standard Deviation (Population) | $5,958 | $16,513 |
Similar Demographics by Median Female Earnings
Demographics Similar to Cubans by Median Female Earnings
In terms of median female earnings, the demographic groups most similar to Cubans are Yaqui ($34,943, a difference of 0.0%), Ute ($34,960, a difference of 0.050%), Apache ($34,895, a difference of 0.13%), Chippewa ($35,003, a difference of 0.17%), and Honduran ($35,013, a difference of 0.20%).
| Demographics | Rating | Rank | Median Female Earnings |
| Fijians | 0.0 /100 | #306 | Tragic $35,114 |
| Sioux | 0.0 /100 | #307 | Tragic $35,063 |
| Immigrants | Bahamas | 0.0 /100 | #308 | Tragic $35,027 |
| Hondurans | 0.0 /100 | #309 | Tragic $35,013 |
| Chippewa | 0.0 /100 | #310 | Tragic $35,003 |
| Ute | 0.0 /100 | #311 | Tragic $34,960 |
| Yaqui | 0.0 /100 | #312 | Tragic $34,943 |
| Cubans | 0.0 /100 | #313 | Tragic $34,942 |
| Apache | 0.0 /100 | #314 | Tragic $34,895 |
| Pennsylvania Germans | 0.0 /100 | #315 | Tragic $34,802 |
| Cherokee | 0.0 /100 | #316 | Tragic $34,742 |
| Potawatomi | 0.0 /100 | #317 | Tragic $34,739 |
| Immigrants | Yemen | 0.0 /100 | #318 | Tragic $34,693 |
| Shoshone | 0.0 /100 | #319 | Tragic $34,677 |
| Immigrants | Honduras | 0.0 /100 | #320 | Tragic $34,647 |
Demographics Similar to South Africans by Median Female Earnings
In terms of median female earnings, the demographic groups most similar to South Africans are Immigrants from Hungary ($41,820, a difference of 0.010%), Moroccan ($41,872, a difference of 0.11%), Immigrants from Netherlands ($41,870, a difference of 0.11%), Immigrants from Scotland ($41,771, a difference of 0.13%), and Immigrants from Grenada ($41,932, a difference of 0.26%).
| Demographics | Rating | Rank | Median Female Earnings |
| Immigrants | Afghanistan | 99.3 /100 | #89 | Exceptional $42,055 |
| Ukrainians | 99.2 /100 | #90 | Exceptional $42,015 |
| Immigrants | Western Europe | 99.2 /100 | #91 | Exceptional $41,990 |
| Argentineans | 99.1 /100 | #92 | Exceptional $41,952 |
| Immigrants | Grenada | 99.0 /100 | #93 | Exceptional $41,932 |
| Moroccans | 98.9 /100 | #94 | Exceptional $41,872 |
| Immigrants | Netherlands | 98.9 /100 | #95 | Exceptional $41,870 |
| South Africans | 98.8 /100 | #96 | Exceptional $41,825 |
| Immigrants | Hungary | 98.8 /100 | #97 | Exceptional $41,820 |
| Immigrants | Scotland | 98.7 /100 | #98 | Exceptional $41,771 |
| Immigrants | Barbados | 98.4 /100 | #99 | Exceptional $41,685 |
| Romanians | 98.3 /100 | #100 | Exceptional $41,663 |
| Immigrants | Fiji | 98.3 /100 | #101 | Exceptional $41,656 |
| Immigrants | Poland | 98.2 /100 | #102 | Exceptional $41,630 |
| Immigrants | Argentina | 97.9 /100 | #103 | Exceptional $41,554 |