Immigrants from Burma/Myanmar vs South African Poverty
COMPARE
Immigrants from Burma/Myanmar
South African
Poverty
Poverty Comparison
Immigrants from Burma/Myanmar
South Africans
14.2%
POVERTY
0.2/ 100
METRIC RATING
251st/ 347
METRIC RANK
11.7%
POVERTY
87.0/ 100
METRIC RATING
129th/ 347
METRIC RANK
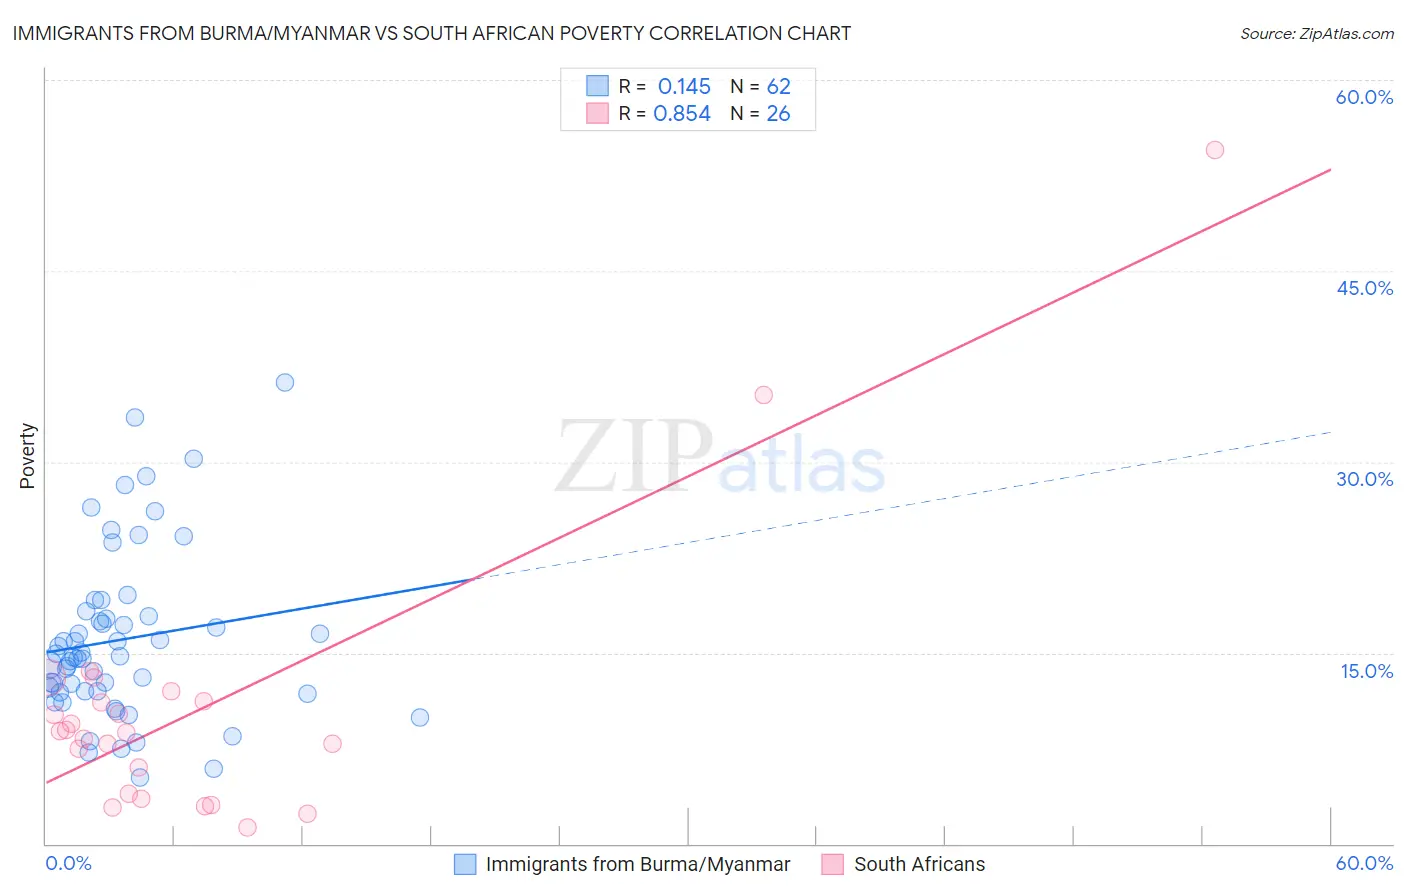
Immigrants from Burma/Myanmar vs South African Poverty Correlation Chart
The statistical analysis conducted on geographies consisting of 172,278,151 people shows a poor positive correlation between the proportion of Immigrants from Burma/Myanmar and poverty level in the United States with a correlation coefficient (R) of 0.145 and weighted average of 14.2%. Similarly, the statistical analysis conducted on geographies consisting of 182,558,592 people shows a very strong positive correlation between the proportion of South Africans and poverty level in the United States with a correlation coefficient (R) of 0.854 and weighted average of 11.7%, a difference of 20.9%.
Poverty Correlation Summary
| Measurement | Immigrants from Burma/Myanmar | South African |
| Minimum | 5.2% | 1.3% |
| Maximum | 36.2% | 54.5% |
| Range | 31.0% | 53.2% |
| Mean | 16.0% | 10.7% |
| Median | 14.7% | 8.8% |
| Interquartile 25% (IQ1) | 12.0% | 3.9% |
| Interquartile 75% (IQ3) | 17.9% | 11.2% |
| Interquartile Range (IQR) | 5.9% | 7.2% |
| Standard Deviation (Sample) | 6.6% | 11.0% |
| Standard Deviation (Population) | 6.6% | 10.8% |
Similar Demographics by Poverty
Demographics Similar to Immigrants from Burma/Myanmar by Poverty
In terms of poverty, the demographic groups most similar to Immigrants from Burma/Myanmar are Cree (14.2%, a difference of 0.090%), Spanish American Indian (14.2%, a difference of 0.11%), Immigrants from Trinidad and Tobago (14.2%, a difference of 0.22%), Immigrants from Ghana (14.2%, a difference of 0.39%), and Immigrants from El Salvador (14.3%, a difference of 0.47%).
| Demographics | Rating | Rank | Poverty |
| Nepalese | 0.3 /100 | #244 | Tragic 14.0% |
| Immigrants | Sudan | 0.3 /100 | #245 | Tragic 14.1% |
| Potawatomi | 0.3 /100 | #246 | Tragic 14.1% |
| Liberians | 0.2 /100 | #247 | Tragic 14.1% |
| Immigrants | Western Africa | 0.2 /100 | #248 | Tragic 14.1% |
| Immigrants | Ghana | 0.2 /100 | #249 | Tragic 14.2% |
| Cree | 0.2 /100 | #250 | Tragic 14.2% |
| Immigrants | Burma/Myanmar | 0.2 /100 | #251 | Tragic 14.2% |
| Spanish American Indians | 0.2 /100 | #252 | Tragic 14.2% |
| Immigrants | Trinidad and Tobago | 0.2 /100 | #253 | Tragic 14.2% |
| Immigrants | El Salvador | 0.1 /100 | #254 | Tragic 14.3% |
| Immigrants | Ecuador | 0.1 /100 | #255 | Tragic 14.3% |
| Mexican American Indians | 0.1 /100 | #256 | Tragic 14.3% |
| Trinidadians and Tobagonians | 0.1 /100 | #257 | Tragic 14.3% |
| Ottawa | 0.1 /100 | #258 | Tragic 14.3% |
Demographics Similar to South Africans by Poverty
In terms of poverty, the demographic groups most similar to South Africans are Immigrants from Israel (11.7%, a difference of 0.090%), Immigrants from Ukraine (11.8%, a difference of 0.090%), French (11.8%, a difference of 0.19%), Immigrants from Argentina (11.7%, a difference of 0.22%), and Immigrants from Norway (11.7%, a difference of 0.24%).
| Demographics | Rating | Rank | Poverty |
| Puget Sound Salish | 88.7 /100 | #122 | Excellent 11.7% |
| Immigrants | Hungary | 88.6 /100 | #123 | Excellent 11.7% |
| Soviet Union | 88.4 /100 | #124 | Excellent 11.7% |
| Immigrants | Brazil | 88.2 /100 | #125 | Excellent 11.7% |
| Immigrants | Norway | 88.0 /100 | #126 | Excellent 11.7% |
| Immigrants | Argentina | 88.0 /100 | #127 | Excellent 11.7% |
| Immigrants | Israel | 87.4 /100 | #128 | Excellent 11.7% |
| South Africans | 87.0 /100 | #129 | Excellent 11.7% |
| Immigrants | Ukraine | 86.6 /100 | #130 | Excellent 11.8% |
| French | 86.1 /100 | #131 | Excellent 11.8% |
| Peruvians | 85.6 /100 | #132 | Excellent 11.8% |
| Immigrants | Western Europe | 85.2 /100 | #133 | Excellent 11.8% |
| Yugoslavians | 85.2 /100 | #134 | Excellent 11.8% |
| Immigrants | Vietnam | 85.2 /100 | #135 | Excellent 11.8% |
| Chileans | 84.2 /100 | #136 | Excellent 11.8% |