Cuban vs Slavic Poverty
COMPARE
Cuban
Slavic
Poverty
Poverty Comparison
Cubans
Slavs
13.9%
POVERTY
0.6/ 100
METRIC RATING
235th/ 347
METRIC RANK
11.5%
POVERTY
93.3/ 100
METRIC RATING
101st/ 347
METRIC RANK
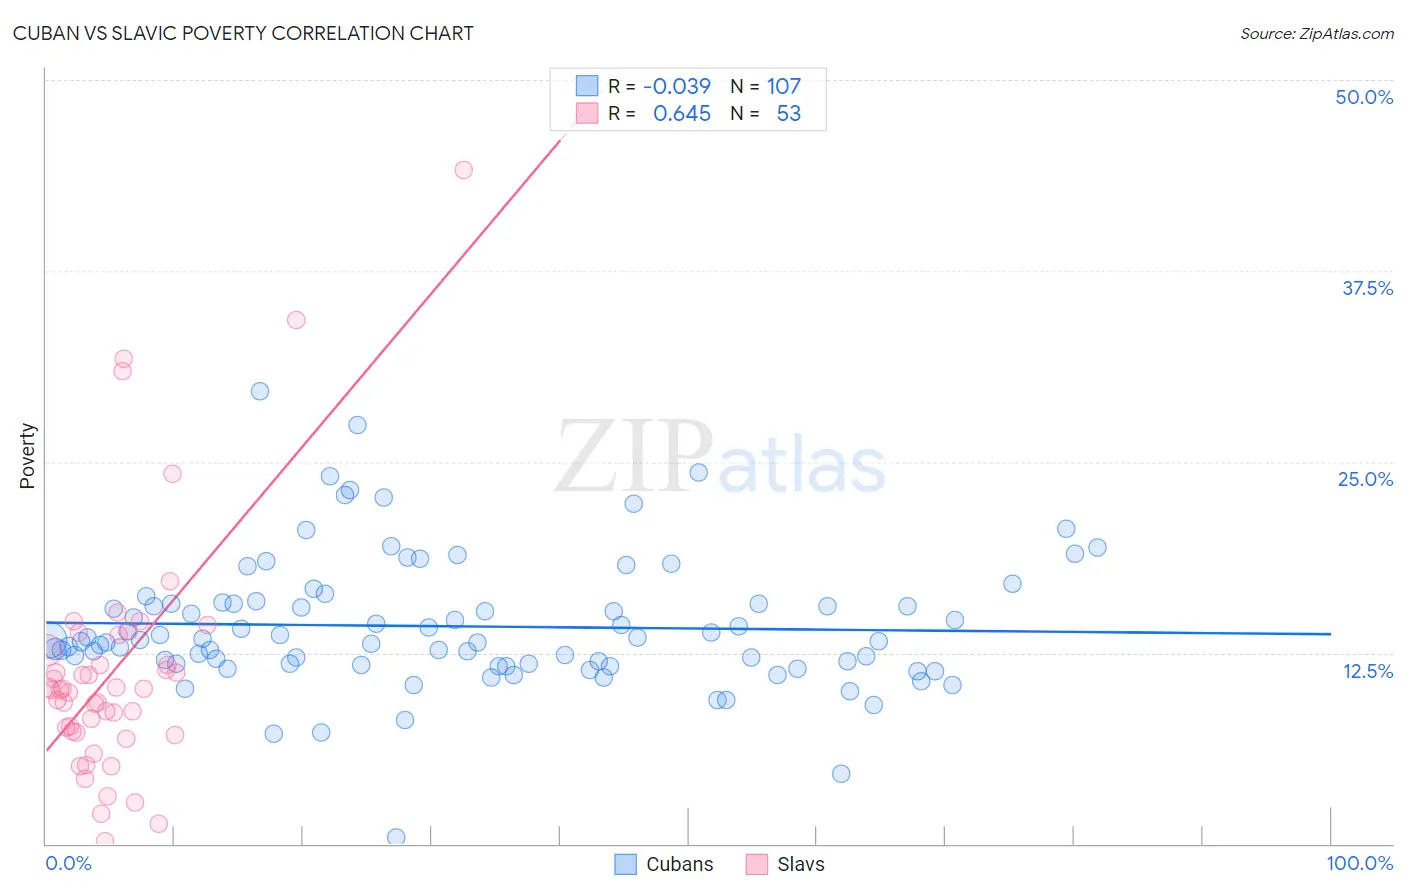
Cuban vs Slavic Poverty Correlation Chart
The statistical analysis conducted on geographies consisting of 448,978,860 people shows no correlation between the proportion of Cubans and poverty level in the United States with a correlation coefficient (R) of -0.039 and weighted average of 13.9%. Similarly, the statistical analysis conducted on geographies consisting of 270,786,783 people shows a significant positive correlation between the proportion of Slavs and poverty level in the United States with a correlation coefficient (R) of 0.645 and weighted average of 11.5%, a difference of 20.3%.
Poverty Correlation Summary
| Measurement | Cuban | Slavic |
| Minimum | 0.38% | 0.14% |
| Maximum | 29.6% | 44.1% |
| Range | 29.3% | 43.9% |
| Mean | 14.2% | 11.4% |
| Median | 13.3% | 10.1% |
| Interquartile 25% (IQ1) | 11.8% | 7.4% |
| Interquartile 75% (IQ3) | 15.7% | 13.2% |
| Interquartile Range (IQR) | 4.0% | 5.8% |
| Standard Deviation (Sample) | 4.3% | 8.2% |
| Standard Deviation (Population) | 4.3% | 8.1% |
Similar Demographics by Poverty
Demographics Similar to Cubans by Poverty
In terms of poverty, the demographic groups most similar to Cubans are Immigrants from Armenia (13.9%, a difference of 0.040%), French American Indian (13.9%, a difference of 0.060%), Ghanaian (13.9%, a difference of 0.19%), Immigrants from Laos (13.8%, a difference of 0.44%), and Nicaraguan (13.9%, a difference of 0.54%).
| Demographics | Rating | Rank | Poverty |
| Immigrants | Nigeria | 1.7 /100 | #228 | Tragic 13.5% |
| Osage | 1.5 /100 | #229 | Tragic 13.6% |
| Alaskan Athabascans | 1.5 /100 | #230 | Tragic 13.6% |
| Nigerians | 1.4 /100 | #231 | Tragic 13.6% |
| Fijians | 0.8 /100 | #232 | Tragic 13.7% |
| Immigrants | Saudi Arabia | 0.8 /100 | #233 | Tragic 13.8% |
| Immigrants | Laos | 0.7 /100 | #234 | Tragic 13.8% |
| Cubans | 0.6 /100 | #235 | Tragic 13.9% |
| Immigrants | Armenia | 0.5 /100 | #236 | Tragic 13.9% |
| French American Indians | 0.5 /100 | #237 | Tragic 13.9% |
| Ghanaians | 0.5 /100 | #238 | Tragic 13.9% |
| Nicaraguans | 0.4 /100 | #239 | Tragic 13.9% |
| Immigrants | Middle Africa | 0.4 /100 | #240 | Tragic 14.0% |
| Salvadorans | 0.4 /100 | #241 | Tragic 14.0% |
| Ecuadorians | 0.4 /100 | #242 | Tragic 14.0% |
Demographics Similar to Slavs by Poverty
In terms of poverty, the demographic groups most similar to Slavs are Scottish (11.5%, a difference of 0.31%), Laotian (11.6%, a difference of 0.34%), Okinawan (11.6%, a difference of 0.34%), Immigrants from Indonesia (11.5%, a difference of 0.42%), and Native Hawaiian (11.6%, a difference of 0.45%).
| Demographics | Rating | Rank | Poverty |
| Paraguayans | 94.9 /100 | #94 | Exceptional 11.4% |
| Australians | 94.9 /100 | #95 | Exceptional 11.4% |
| Immigrants | South Africa | 94.7 /100 | #96 | Exceptional 11.5% |
| Immigrants | Egypt | 94.6 /100 | #97 | Exceptional 11.5% |
| Immigrants | Latvia | 94.5 /100 | #98 | Exceptional 11.5% |
| Immigrants | Indonesia | 94.2 /100 | #99 | Exceptional 11.5% |
| Scottish | 94.0 /100 | #100 | Exceptional 11.5% |
| Slavs | 93.3 /100 | #101 | Exceptional 11.5% |
| Laotians | 92.4 /100 | #102 | Exceptional 11.6% |
| Okinawans | 92.4 /100 | #103 | Exceptional 11.6% |
| Native Hawaiians | 92.1 /100 | #104 | Exceptional 11.6% |
| Portuguese | 92.1 /100 | #105 | Exceptional 11.6% |
| Immigrants | Zimbabwe | 92.1 /100 | #106 | Exceptional 11.6% |
| Palestinians | 91.8 /100 | #107 | Exceptional 11.6% |
| Canadians | 91.7 /100 | #108 | Exceptional 11.6% |