Cuban vs Japanese Poverty
COMPARE
Cuban
Japanese
Poverty
Poverty Comparison
Cubans
Japanese
13.9%
POVERTY
0.6/ 100
METRIC RATING
235th/ 347
METRIC RANK
13.3%
POVERTY
3.3/ 100
METRIC RATING
215th/ 347
METRIC RANK
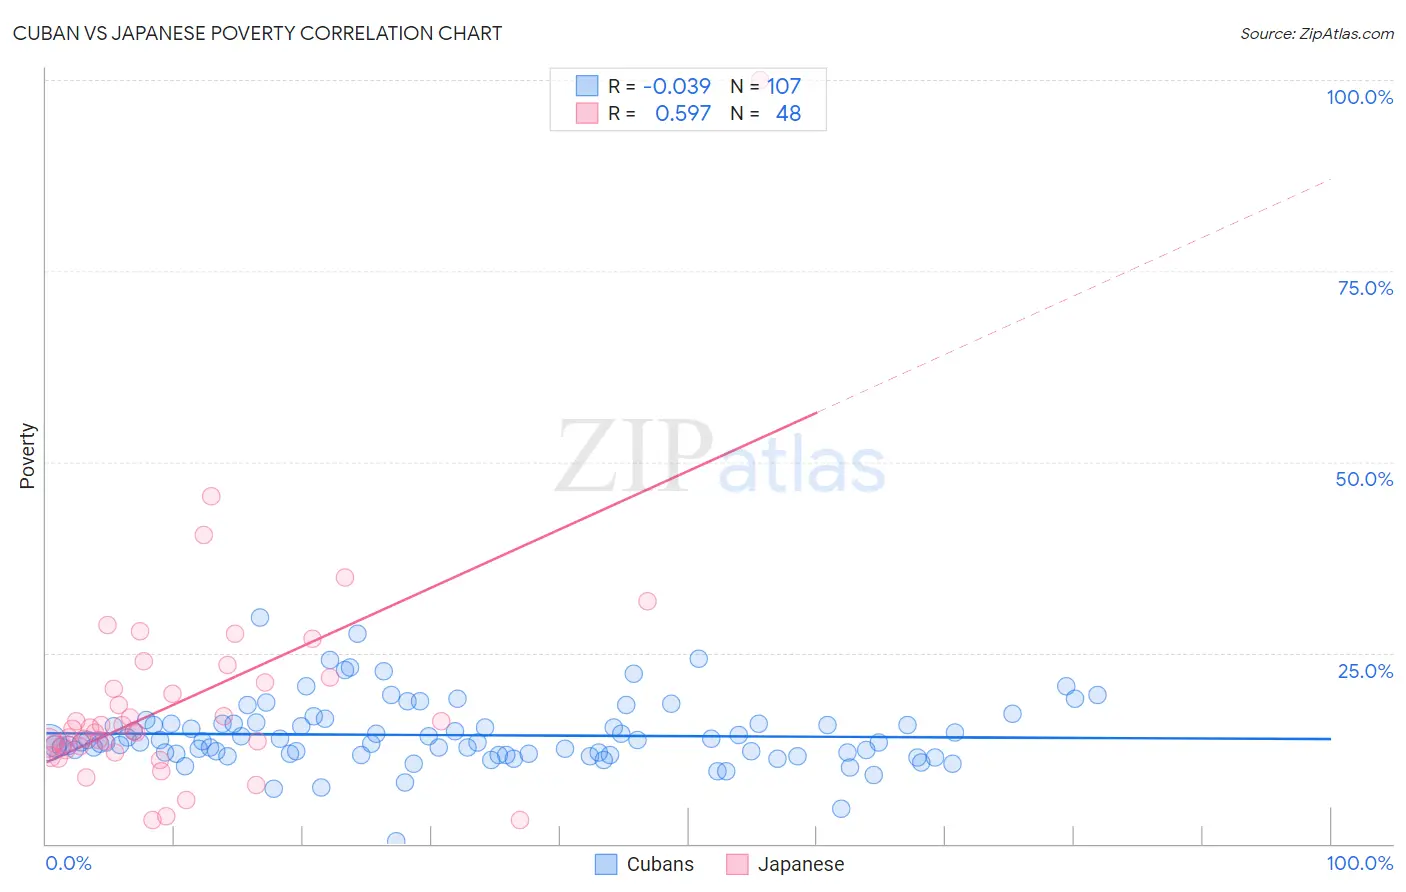
Cuban vs Japanese Poverty Correlation Chart
The statistical analysis conducted on geographies consisting of 448,978,860 people shows no correlation between the proportion of Cubans and poverty level in the United States with a correlation coefficient (R) of -0.039 and weighted average of 13.9%. Similarly, the statistical analysis conducted on geographies consisting of 249,091,915 people shows a substantial positive correlation between the proportion of Japanese and poverty level in the United States with a correlation coefficient (R) of 0.597 and weighted average of 13.3%, a difference of 4.1%.
Poverty Correlation Summary
| Measurement | Cuban | Japanese |
| Minimum | 0.38% | 3.1% |
| Maximum | 29.6% | 100.0% |
| Range | 29.3% | 96.9% |
| Mean | 14.2% | 18.8% |
| Median | 13.3% | 14.9% |
| Interquartile 25% (IQ1) | 11.8% | 12.5% |
| Interquartile 75% (IQ3) | 15.7% | 21.4% |
| Interquartile Range (IQR) | 4.0% | 8.9% |
| Standard Deviation (Sample) | 4.3% | 14.9% |
| Standard Deviation (Population) | 4.3% | 14.8% |
Demographics Similar to Cubans and Japanese by Poverty
In terms of poverty, the demographic groups most similar to Cubans are Immigrants from Laos (13.8%, a difference of 0.44%), Immigrants from Saudi Arabia (13.8%, a difference of 0.68%), Fijian (13.7%, a difference of 0.93%), Nigerian (13.6%, a difference of 2.0%), and Alaskan Athabascan (13.6%, a difference of 2.2%). Similarly, the demographic groups most similar to Japanese are Nonimmigrants (13.3%, a difference of 0.0%), Immigrants from Uzbekistan (13.3%, a difference of 0.040%), Immigrants from Thailand (13.3%, a difference of 0.10%), Immigrants from Cambodia (13.4%, a difference of 0.23%), and American (13.4%, a difference of 0.32%).
| Demographics | Rating | Rank | Poverty |
| Japanese | 3.3 /100 | #215 | Tragic 13.3% |
| Immigrants | Nonimmigrants | 3.3 /100 | #216 | Tragic 13.3% |
| Immigrants | Uzbekistan | 3.2 /100 | #217 | Tragic 13.3% |
| Immigrants | Thailand | 3.1 /100 | #218 | Tragic 13.3% |
| Immigrants | Cambodia | 3.0 /100 | #219 | Tragic 13.4% |
| Americans | 2.9 /100 | #220 | Tragic 13.4% |
| Alsatians | 2.6 /100 | #221 | Tragic 13.4% |
| Immigrants | Micronesia | 2.6 /100 | #222 | Tragic 13.4% |
| Immigrants | Africa | 2.5 /100 | #223 | Tragic 13.4% |
| Immigrants | Eritrea | 2.4 /100 | #224 | Tragic 13.4% |
| German Russians | 2.2 /100 | #225 | Tragic 13.4% |
| Marshallese | 2.2 /100 | #226 | Tragic 13.4% |
| Alaska Natives | 2.1 /100 | #227 | Tragic 13.5% |
| Immigrants | Nigeria | 1.7 /100 | #228 | Tragic 13.5% |
| Osage | 1.5 /100 | #229 | Tragic 13.6% |
| Alaskan Athabascans | 1.5 /100 | #230 | Tragic 13.6% |
| Nigerians | 1.4 /100 | #231 | Tragic 13.6% |
| Fijians | 0.8 /100 | #232 | Tragic 13.7% |
| Immigrants | Saudi Arabia | 0.8 /100 | #233 | Tragic 13.8% |
| Immigrants | Laos | 0.7 /100 | #234 | Tragic 13.8% |
| Cubans | 0.6 /100 | #235 | Tragic 13.9% |