Cuban vs South African In Labor Force | Age 16-19
COMPARE
Cuban
South African
In Labor Force | Age 16-19
In Labor Force | Age 16-19 Comparison
Cubans
South Africans
31.8%
IN LABOR FORCE | AGE 16-19
0.0/ 100
METRIC RATING
314th/ 347
METRIC RANK
36.7%
IN LABOR FORCE | AGE 16-19
58.3/ 100
METRIC RATING
172nd/ 347
METRIC RANK
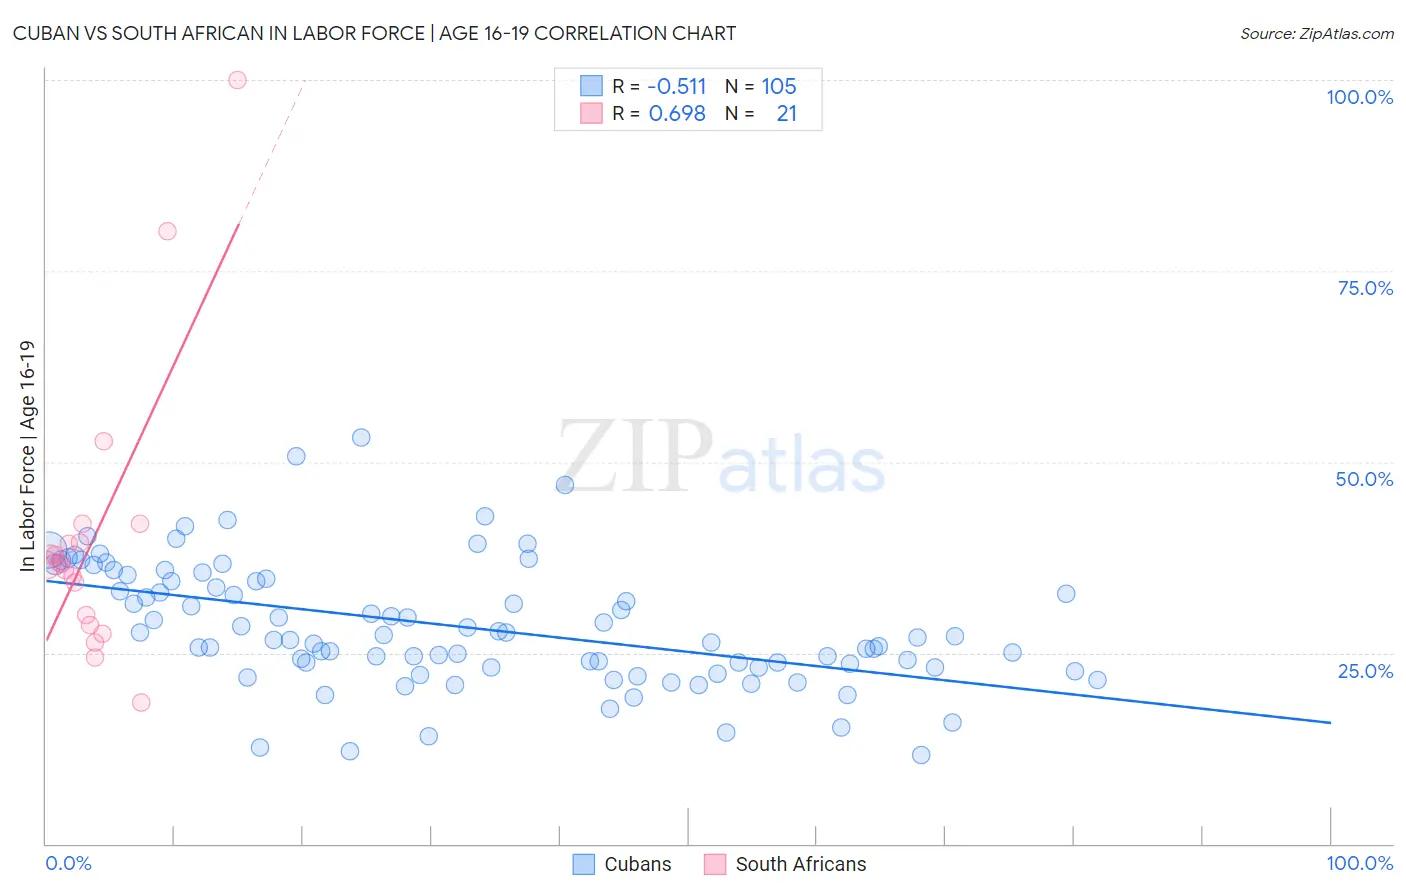
Cuban vs South African In Labor Force | Age 16-19 Correlation Chart
The statistical analysis conducted on geographies consisting of 448,345,654 people shows a substantial negative correlation between the proportion of Cubans and labor force participation rate among population between the ages 16 and 19 in the United States with a correlation coefficient (R) of -0.511 and weighted average of 31.8%. Similarly, the statistical analysis conducted on geographies consisting of 182,382,145 people shows a significant positive correlation between the proportion of South Africans and labor force participation rate among population between the ages 16 and 19 in the United States with a correlation coefficient (R) of 0.698 and weighted average of 36.7%, a difference of 15.6%.
In Labor Force | Age 16-19 Correlation Summary
| Measurement | Cuban | South African |
| Minimum | 11.7% | 18.5% |
| Maximum | 53.2% | 100.0% |
| Range | 41.5% | 81.5% |
| Mean | 28.5% | 40.1% |
| Median | 27.0% | 36.7% |
| Interquartile 25% (IQ1) | 23.0% | 29.3% |
| Interquartile 75% (IQ3) | 34.6% | 40.7% |
| Interquartile Range (IQR) | 11.6% | 11.4% |
| Standard Deviation (Sample) | 8.1% | 18.4% |
| Standard Deviation (Population) | 8.1% | 18.0% |
Similar Demographics by In Labor Force | Age 16-19
Demographics Similar to Cubans by In Labor Force | Age 16-19
In terms of in labor force | age 16-19, the demographic groups most similar to Cubans are Immigrants from Belize (31.8%, a difference of 0.16%), Hopi (31.8%, a difference of 0.16%), Immigrants from West Indies (31.7%, a difference of 0.18%), Filipino (31.7%, a difference of 0.26%), and Indian (Asian) (31.9%, a difference of 0.31%).
| Demographics | Rating | Rank | In Labor Force | Age 16-19 |
| Immigrants | Jamaica | 0.0 /100 | #307 | Tragic 32.2% |
| Navajo | 0.0 /100 | #308 | Tragic 32.1% |
| Immigrants | Eastern Asia | 0.0 /100 | #309 | Tragic 32.0% |
| Immigrants | Iran | 0.0 /100 | #310 | Tragic 32.0% |
| Indians (Asian) | 0.0 /100 | #311 | Tragic 31.9% |
| Immigrants | Belize | 0.0 /100 | #312 | Tragic 31.8% |
| Hopi | 0.0 /100 | #313 | Tragic 31.8% |
| Cubans | 0.0 /100 | #314 | Tragic 31.8% |
| Immigrants | West Indies | 0.0 /100 | #315 | Tragic 31.7% |
| Filipinos | 0.0 /100 | #316 | Tragic 31.7% |
| Immigrants | Nicaragua | 0.0 /100 | #317 | Tragic 31.6% |
| Immigrants | Yemen | 0.0 /100 | #318 | Tragic 31.5% |
| Soviet Union | 0.0 /100 | #319 | Tragic 31.4% |
| Ecuadorians | 0.0 /100 | #320 | Tragic 31.4% |
| West Indians | 0.0 /100 | #321 | Tragic 31.3% |
Demographics Similar to South Africans by In Labor Force | Age 16-19
In terms of in labor force | age 16-19, the demographic groups most similar to South Africans are Immigrants from Cambodia (36.7%, a difference of 0.010%), Russian (36.7%, a difference of 0.040%), Immigrants from South Africa (36.8%, a difference of 0.11%), Immigrants from Latvia (36.8%, a difference of 0.17%), and Palestinian (36.8%, a difference of 0.25%).
| Demographics | Rating | Rank | In Labor Force | Age 16-19 |
| Yakama | 66.9 /100 | #165 | Good 36.9% |
| Immigrants | Western Africa | 66.7 /100 | #166 | Good 36.9% |
| Arabs | 63.6 /100 | #167 | Good 36.8% |
| Palestinians | 63.1 /100 | #168 | Good 36.8% |
| Immigrants | Latvia | 61.6 /100 | #169 | Good 36.8% |
| Immigrants | South Africa | 60.5 /100 | #170 | Good 36.8% |
| Immigrants | Cambodia | 58.4 /100 | #171 | Average 36.7% |
| South Africans | 58.3 /100 | #172 | Average 36.7% |
| Russians | 57.5 /100 | #173 | Average 36.7% |
| Immigrants | Czechoslovakia | 50.0 /100 | #174 | Average 36.6% |
| Natives/Alaskans | 49.0 /100 | #175 | Average 36.6% |
| Albanians | 48.8 /100 | #176 | Average 36.5% |
| Immigrants | Northern Europe | 46.6 /100 | #177 | Average 36.5% |
| Blacks/African Americans | 45.1 /100 | #178 | Average 36.5% |
| Immigrants | Southern Europe | 43.3 /100 | #179 | Average 36.4% |