Asian vs South African Poverty
COMPARE
Asian
South African
Poverty
Poverty Comparison
Asians
South Africans
11.0%
POVERTY
98.9/ 100
METRIC RATING
50th/ 347
METRIC RANK
11.7%
POVERTY
87.0/ 100
METRIC RATING
129th/ 347
METRIC RANK
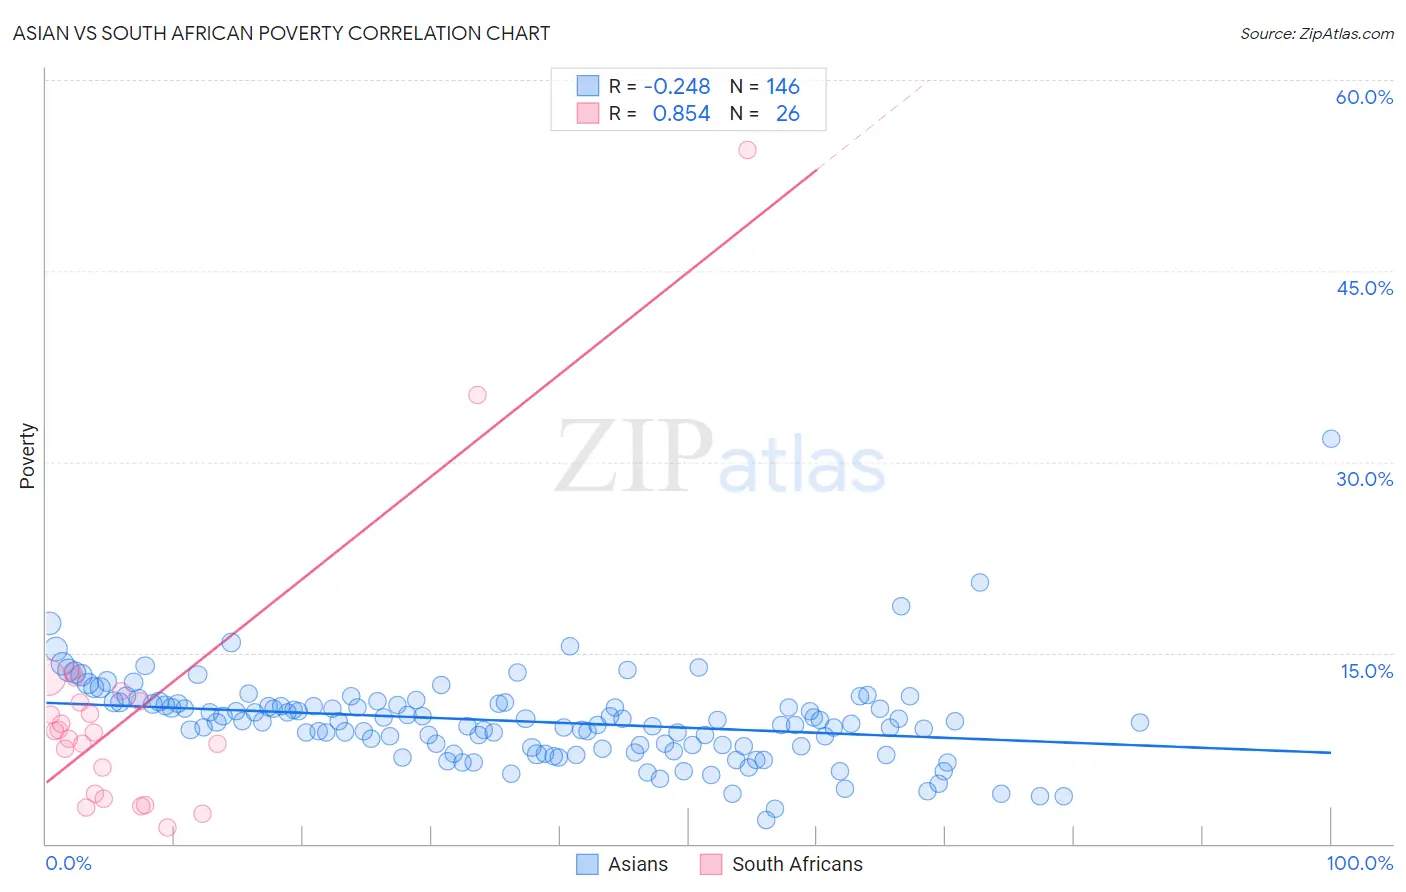
Asian vs South African Poverty Correlation Chart
The statistical analysis conducted on geographies consisting of 550,188,892 people shows a weak negative correlation between the proportion of Asians and poverty level in the United States with a correlation coefficient (R) of -0.248 and weighted average of 11.0%. Similarly, the statistical analysis conducted on geographies consisting of 182,558,592 people shows a very strong positive correlation between the proportion of South Africans and poverty level in the United States with a correlation coefficient (R) of 0.854 and weighted average of 11.7%, a difference of 7.0%.
Poverty Correlation Summary
| Measurement | Asian | South African |
| Minimum | 1.8% | 1.3% |
| Maximum | 31.8% | 54.5% |
| Range | 29.9% | 53.2% |
| Mean | 9.6% | 10.7% |
| Median | 9.6% | 8.8% |
| Interquartile 25% (IQ1) | 7.6% | 3.9% |
| Interquartile 75% (IQ3) | 11.0% | 11.2% |
| Interquartile Range (IQR) | 3.4% | 7.2% |
| Standard Deviation (Sample) | 3.5% | 11.0% |
| Standard Deviation (Population) | 3.5% | 10.8% |
Similar Demographics by Poverty
Demographics Similar to Asians by Poverty
In terms of poverty, the demographic groups most similar to Asians are Immigrants from Japan (11.0%, a difference of 0.030%), Slovene (11.0%, a difference of 0.040%), Immigrants from Romania (11.0%, a difference of 0.080%), Immigrants from Czechoslovakia (11.0%, a difference of 0.10%), and Turkish (11.0%, a difference of 0.18%).
| Demographics | Rating | Rank | Poverty |
| Immigrants | Singapore | 99.2 /100 | #43 | Exceptional 10.9% |
| Immigrants | Moldova | 99.1 /100 | #44 | Exceptional 10.9% |
| Turks | 98.9 /100 | #45 | Exceptional 11.0% |
| Immigrants | Czechoslovakia | 98.9 /100 | #46 | Exceptional 11.0% |
| Immigrants | Romania | 98.9 /100 | #47 | Exceptional 11.0% |
| Slovenes | 98.9 /100 | #48 | Exceptional 11.0% |
| Immigrants | Japan | 98.9 /100 | #49 | Exceptional 11.0% |
| Asians | 98.9 /100 | #50 | Exceptional 11.0% |
| Immigrants | Croatia | 98.7 /100 | #51 | Exceptional 11.0% |
| Immigrants | Philippines | 98.7 /100 | #52 | Exceptional 11.0% |
| Immigrants | Austria | 98.6 /100 | #53 | Exceptional 11.1% |
| Immigrants | Bulgaria | 98.5 /100 | #54 | Exceptional 11.1% |
| Immigrants | Serbia | 98.5 /100 | #55 | Exceptional 11.1% |
| Estonians | 98.2 /100 | #56 | Exceptional 11.1% |
| Scandinavians | 98.2 /100 | #57 | Exceptional 11.1% |
Demographics Similar to South Africans by Poverty
In terms of poverty, the demographic groups most similar to South Africans are Immigrants from Israel (11.7%, a difference of 0.090%), Immigrants from Ukraine (11.8%, a difference of 0.090%), French (11.8%, a difference of 0.19%), Immigrants from Argentina (11.7%, a difference of 0.22%), and Immigrants from Norway (11.7%, a difference of 0.24%).
| Demographics | Rating | Rank | Poverty |
| Puget Sound Salish | 88.7 /100 | #122 | Excellent 11.7% |
| Immigrants | Hungary | 88.6 /100 | #123 | Excellent 11.7% |
| Soviet Union | 88.4 /100 | #124 | Excellent 11.7% |
| Immigrants | Brazil | 88.2 /100 | #125 | Excellent 11.7% |
| Immigrants | Norway | 88.0 /100 | #126 | Excellent 11.7% |
| Immigrants | Argentina | 88.0 /100 | #127 | Excellent 11.7% |
| Immigrants | Israel | 87.4 /100 | #128 | Excellent 11.7% |
| South Africans | 87.0 /100 | #129 | Excellent 11.7% |
| Immigrants | Ukraine | 86.6 /100 | #130 | Excellent 11.8% |
| French | 86.1 /100 | #131 | Excellent 11.8% |
| Peruvians | 85.6 /100 | #132 | Excellent 11.8% |
| Immigrants | Western Europe | 85.2 /100 | #133 | Excellent 11.8% |
| Yugoslavians | 85.2 /100 | #134 | Excellent 11.8% |
| Immigrants | Vietnam | 85.2 /100 | #135 | Excellent 11.8% |
| Chileans | 84.2 /100 | #136 | Excellent 11.8% |