Cuban vs South African Associate's Degree
COMPARE
Cuban
South African
Associate's Degree
Associate's Degree Comparison
Cubans
South Africans
41.9%
ASSOCIATE'S DEGREE
0.6/ 100
METRIC RATING
254th/ 347
METRIC RANK
51.4%
ASSOCIATE'S DEGREE
99.7/ 100
METRIC RATING
63rd/ 347
METRIC RANK
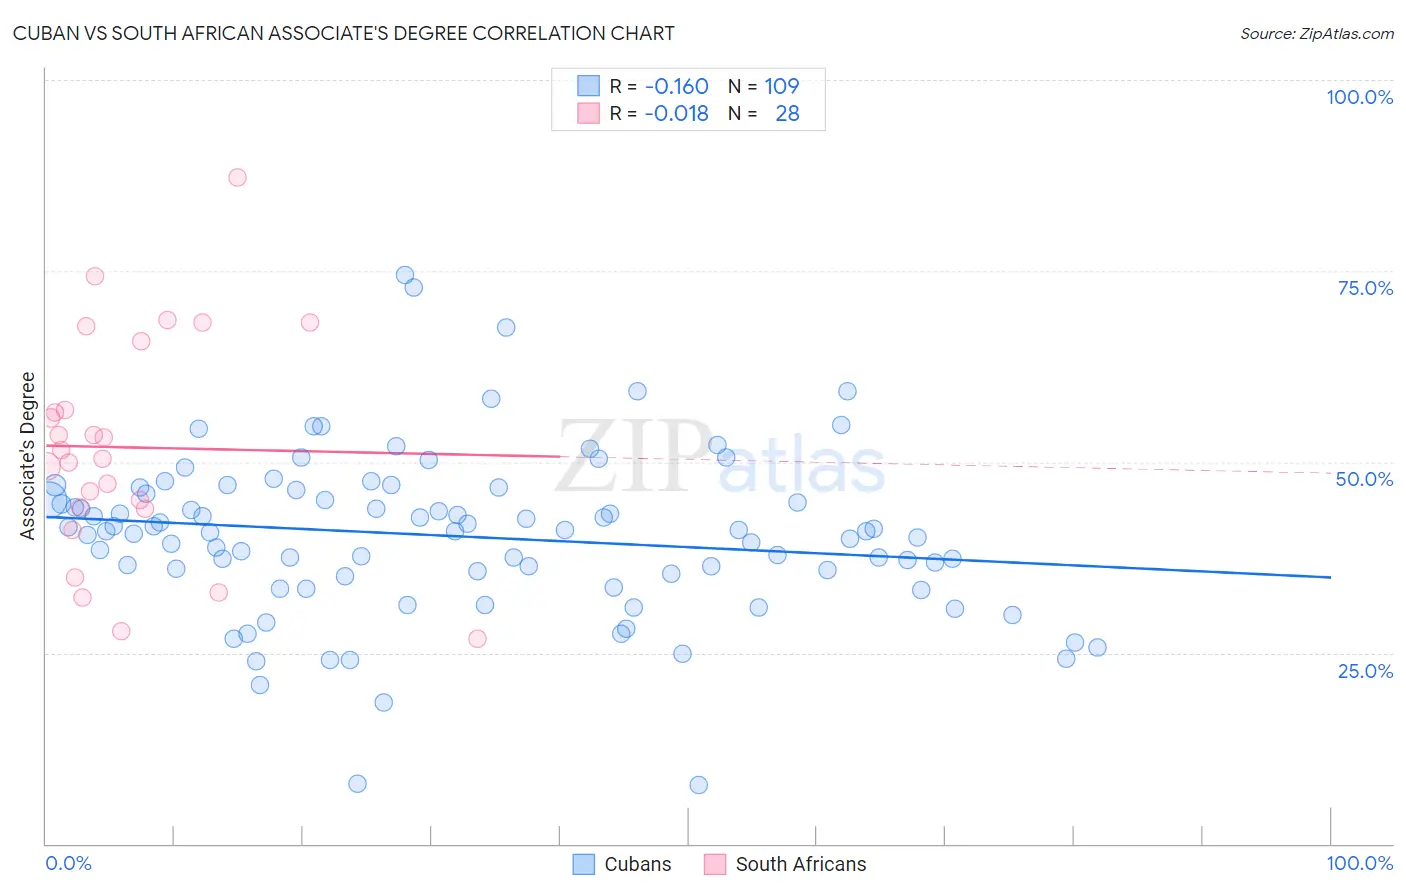
Cuban vs South African Associate's Degree Correlation Chart
The statistical analysis conducted on geographies consisting of 449,326,407 people shows a poor negative correlation between the proportion of Cubans and percentage of population with at least associate's degree education in the United States with a correlation coefficient (R) of -0.160 and weighted average of 41.9%. Similarly, the statistical analysis conducted on geographies consisting of 182,596,530 people shows no correlation between the proportion of South Africans and percentage of population with at least associate's degree education in the United States with a correlation coefficient (R) of -0.018 and weighted average of 51.4%, a difference of 22.7%.
Associate's Degree Correlation Summary
| Measurement | Cuban | South African |
| Minimum | 7.8% | 26.9% |
| Maximum | 74.4% | 87.3% |
| Range | 66.7% | 60.4% |
| Mean | 40.3% | 51.9% |
| Median | 41.0% | 50.9% |
| Interquartile 25% (IQ1) | 35.1% | 44.0% |
| Interquartile 75% (IQ3) | 46.0% | 61.2% |
| Interquartile Range (IQR) | 10.9% | 17.3% |
| Standard Deviation (Sample) | 10.9% | 14.5% |
| Standard Deviation (Population) | 10.8% | 14.2% |
Similar Demographics by Associate's Degree
Demographics Similar to Cubans by Associate's Degree
In terms of associate's degree, the demographic groups most similar to Cubans are Indonesian (41.9%, a difference of 0.060%), Immigrants from Guyana (41.8%, a difference of 0.090%), French American Indian (42.0%, a difference of 0.17%), Immigrants from Congo (41.8%, a difference of 0.21%), and Spanish American (41.8%, a difference of 0.27%).
| Demographics | Rating | Rank | Associate's Degree |
| Immigrants | Fiji | 0.8 /100 | #247 | Tragic 42.2% |
| Immigrants | Ecuador | 0.8 /100 | #248 | Tragic 42.2% |
| Jamaicans | 0.7 /100 | #249 | Tragic 42.1% |
| U.S. Virgin Islanders | 0.7 /100 | #250 | Tragic 42.1% |
| Immigrants | Bahamas | 0.7 /100 | #251 | Tragic 42.1% |
| French American Indians | 0.6 /100 | #252 | Tragic 42.0% |
| Indonesians | 0.6 /100 | #253 | Tragic 41.9% |
| Cubans | 0.6 /100 | #254 | Tragic 41.9% |
| Immigrants | Guyana | 0.5 /100 | #255 | Tragic 41.8% |
| Immigrants | Congo | 0.5 /100 | #256 | Tragic 41.8% |
| Spanish Americans | 0.5 /100 | #257 | Tragic 41.8% |
| Japanese | 0.5 /100 | #258 | Tragic 41.7% |
| Malaysians | 0.4 /100 | #259 | Tragic 41.6% |
| Marshallese | 0.4 /100 | #260 | Tragic 41.6% |
| Nicaraguans | 0.4 /100 | #261 | Tragic 41.5% |
Demographics Similar to South Africans by Associate's Degree
In terms of associate's degree, the demographic groups most similar to South Africans are Bhutanese (51.4%, a difference of 0.050%), Immigrants from Kazakhstan (51.4%, a difference of 0.060%), Immigrants from Netherlands (51.4%, a difference of 0.070%), Zimbabwean (51.3%, a difference of 0.10%), and Immigrants from Europe (51.3%, a difference of 0.16%).
| Demographics | Rating | Rank | Associate's Degree |
| Immigrants | Czechoslovakia | 99.8 /100 | #56 | Exceptional 51.9% |
| Paraguayans | 99.8 /100 | #57 | Exceptional 51.8% |
| New Zealanders | 99.8 /100 | #58 | Exceptional 51.8% |
| Immigrants | Serbia | 99.8 /100 | #59 | Exceptional 51.7% |
| Immigrants | Bolivia | 99.7 /100 | #60 | Exceptional 51.5% |
| Immigrants | Kazakhstan | 99.7 /100 | #61 | Exceptional 51.4% |
| Bhutanese | 99.7 /100 | #62 | Exceptional 51.4% |
| South Africans | 99.7 /100 | #63 | Exceptional 51.4% |
| Immigrants | Netherlands | 99.7 /100 | #64 | Exceptional 51.4% |
| Zimbabweans | 99.7 /100 | #65 | Exceptional 51.3% |
| Immigrants | Europe | 99.7 /100 | #66 | Exceptional 51.3% |
| Argentineans | 99.6 /100 | #67 | Exceptional 51.2% |
| Immigrants | Indonesia | 99.5 /100 | #68 | Exceptional 51.0% |
| Egyptians | 99.5 /100 | #69 | Exceptional 50.9% |
| Immigrants | Argentina | 99.5 /100 | #70 | Exceptional 50.9% |