Immigrants from Trinidad and Tobago vs South African Poverty
COMPARE
Immigrants from Trinidad and Tobago
South African
Poverty
Poverty Comparison
Immigrants from Trinidad and Tobago
South Africans
14.2%
POVERTY
0.2/ 100
METRIC RATING
253rd/ 347
METRIC RANK
11.7%
POVERTY
87.0/ 100
METRIC RATING
129th/ 347
METRIC RANK
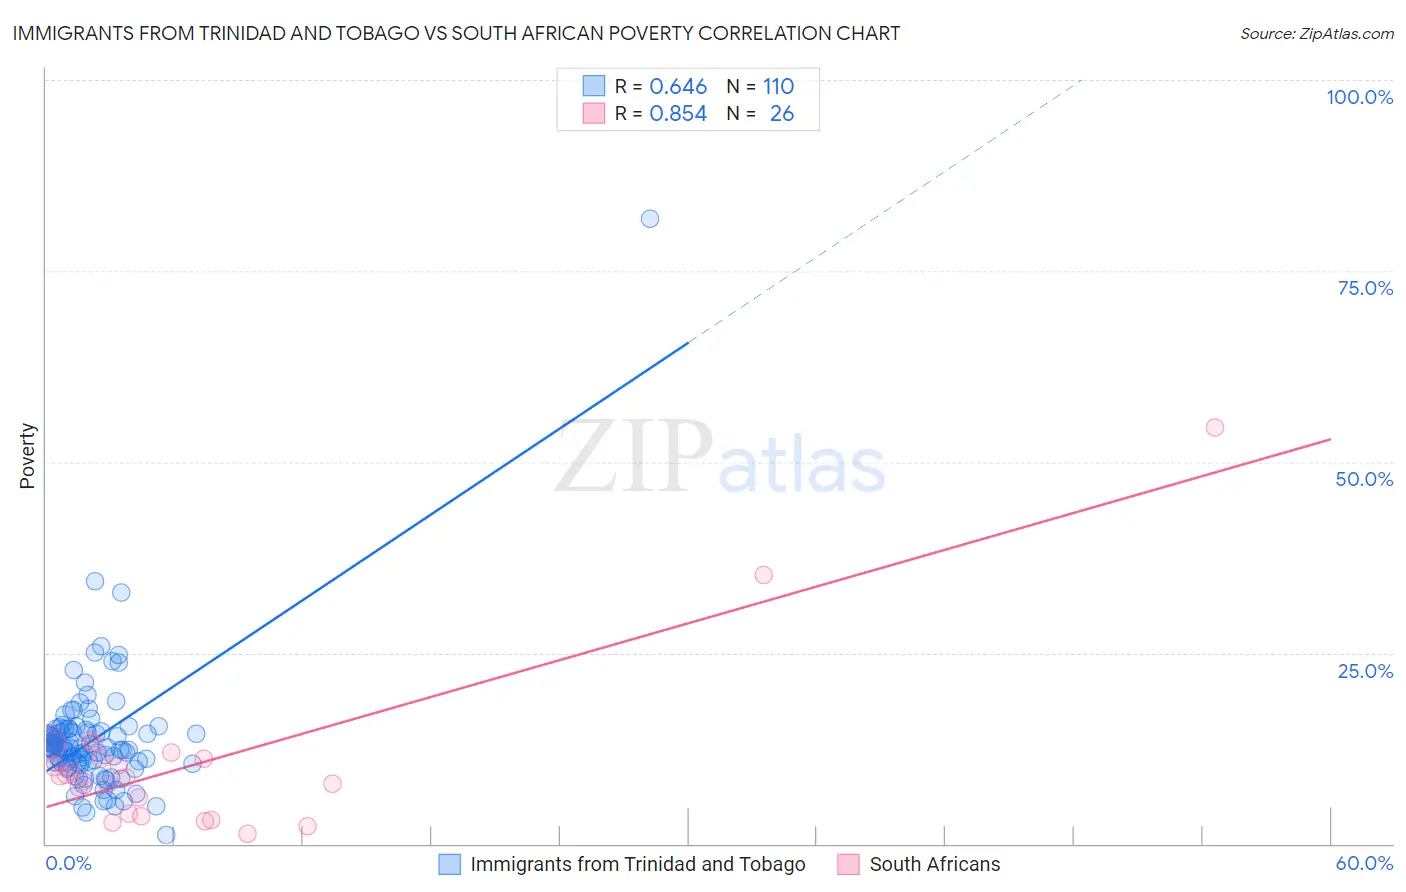
Immigrants from Trinidad and Tobago vs South African Poverty Correlation Chart
The statistical analysis conducted on geographies consisting of 223,476,613 people shows a significant positive correlation between the proportion of Immigrants from Trinidad and Tobago and poverty level in the United States with a correlation coefficient (R) of 0.646 and weighted average of 14.2%. Similarly, the statistical analysis conducted on geographies consisting of 182,558,592 people shows a very strong positive correlation between the proportion of South Africans and poverty level in the United States with a correlation coefficient (R) of 0.854 and weighted average of 11.7%, a difference of 21.2%.
Poverty Correlation Summary
| Measurement | Immigrants from Trinidad and Tobago | South African |
| Minimum | 1.1% | 1.3% |
| Maximum | 81.9% | 54.5% |
| Range | 80.8% | 53.2% |
| Mean | 13.7% | 10.7% |
| Median | 12.5% | 8.8% |
| Interquartile 25% (IQ1) | 10.6% | 3.9% |
| Interquartile 75% (IQ3) | 14.9% | 11.2% |
| Interquartile Range (IQR) | 4.3% | 7.2% |
| Standard Deviation (Sample) | 8.4% | 11.0% |
| Standard Deviation (Population) | 8.4% | 10.8% |
Similar Demographics by Poverty
Demographics Similar to Immigrants from Trinidad and Tobago by Poverty
In terms of poverty, the demographic groups most similar to Immigrants from Trinidad and Tobago are Spanish American Indian (14.2%, a difference of 0.10%), Immigrants from Burma/Myanmar (14.2%, a difference of 0.22%), Immigrants from El Salvador (14.3%, a difference of 0.25%), Cree (14.2%, a difference of 0.31%), and Immigrants from Ecuador (14.3%, a difference of 0.35%).
| Demographics | Rating | Rank | Poverty |
| Potawatomi | 0.3 /100 | #246 | Tragic 14.1% |
| Liberians | 0.2 /100 | #247 | Tragic 14.1% |
| Immigrants | Western Africa | 0.2 /100 | #248 | Tragic 14.1% |
| Immigrants | Ghana | 0.2 /100 | #249 | Tragic 14.2% |
| Cree | 0.2 /100 | #250 | Tragic 14.2% |
| Immigrants | Burma/Myanmar | 0.2 /100 | #251 | Tragic 14.2% |
| Spanish American Indians | 0.2 /100 | #252 | Tragic 14.2% |
| Immigrants | Trinidad and Tobago | 0.2 /100 | #253 | Tragic 14.2% |
| Immigrants | El Salvador | 0.1 /100 | #254 | Tragic 14.3% |
| Immigrants | Ecuador | 0.1 /100 | #255 | Tragic 14.3% |
| Mexican American Indians | 0.1 /100 | #256 | Tragic 14.3% |
| Trinidadians and Tobagonians | 0.1 /100 | #257 | Tragic 14.3% |
| Ottawa | 0.1 /100 | #258 | Tragic 14.3% |
| Immigrants | Nicaragua | 0.1 /100 | #259 | Tragic 14.3% |
| Cape Verdeans | 0.1 /100 | #260 | Tragic 14.4% |
Demographics Similar to South Africans by Poverty
In terms of poverty, the demographic groups most similar to South Africans are Immigrants from Israel (11.7%, a difference of 0.090%), Immigrants from Ukraine (11.8%, a difference of 0.090%), French (11.8%, a difference of 0.19%), Immigrants from Argentina (11.7%, a difference of 0.22%), and Immigrants from Norway (11.7%, a difference of 0.24%).
| Demographics | Rating | Rank | Poverty |
| Puget Sound Salish | 88.7 /100 | #122 | Excellent 11.7% |
| Immigrants | Hungary | 88.6 /100 | #123 | Excellent 11.7% |
| Soviet Union | 88.4 /100 | #124 | Excellent 11.7% |
| Immigrants | Brazil | 88.2 /100 | #125 | Excellent 11.7% |
| Immigrants | Norway | 88.0 /100 | #126 | Excellent 11.7% |
| Immigrants | Argentina | 88.0 /100 | #127 | Excellent 11.7% |
| Immigrants | Israel | 87.4 /100 | #128 | Excellent 11.7% |
| South Africans | 87.0 /100 | #129 | Excellent 11.7% |
| Immigrants | Ukraine | 86.6 /100 | #130 | Excellent 11.8% |
| French | 86.1 /100 | #131 | Excellent 11.8% |
| Peruvians | 85.6 /100 | #132 | Excellent 11.8% |
| Immigrants | Western Europe | 85.2 /100 | #133 | Excellent 11.8% |
| Yugoslavians | 85.2 /100 | #134 | Excellent 11.8% |
| Immigrants | Vietnam | 85.2 /100 | #135 | Excellent 11.8% |
| Chileans | 84.2 /100 | #136 | Excellent 11.8% |