Hispanic or Latino vs Immigrants from Romania Female Poverty
COMPARE
Hispanic or Latino
Immigrants from Romania
Female Poverty
Female Poverty Comparison
Hispanics or Latinos
Immigrants from Romania
16.6%
FEMALE POVERTY
0.0/ 100
METRIC RATING
299th/ 347
METRIC RANK
12.0%
FEMALE POVERTY
99.0/ 100
METRIC RATING
49th/ 347
METRIC RANK
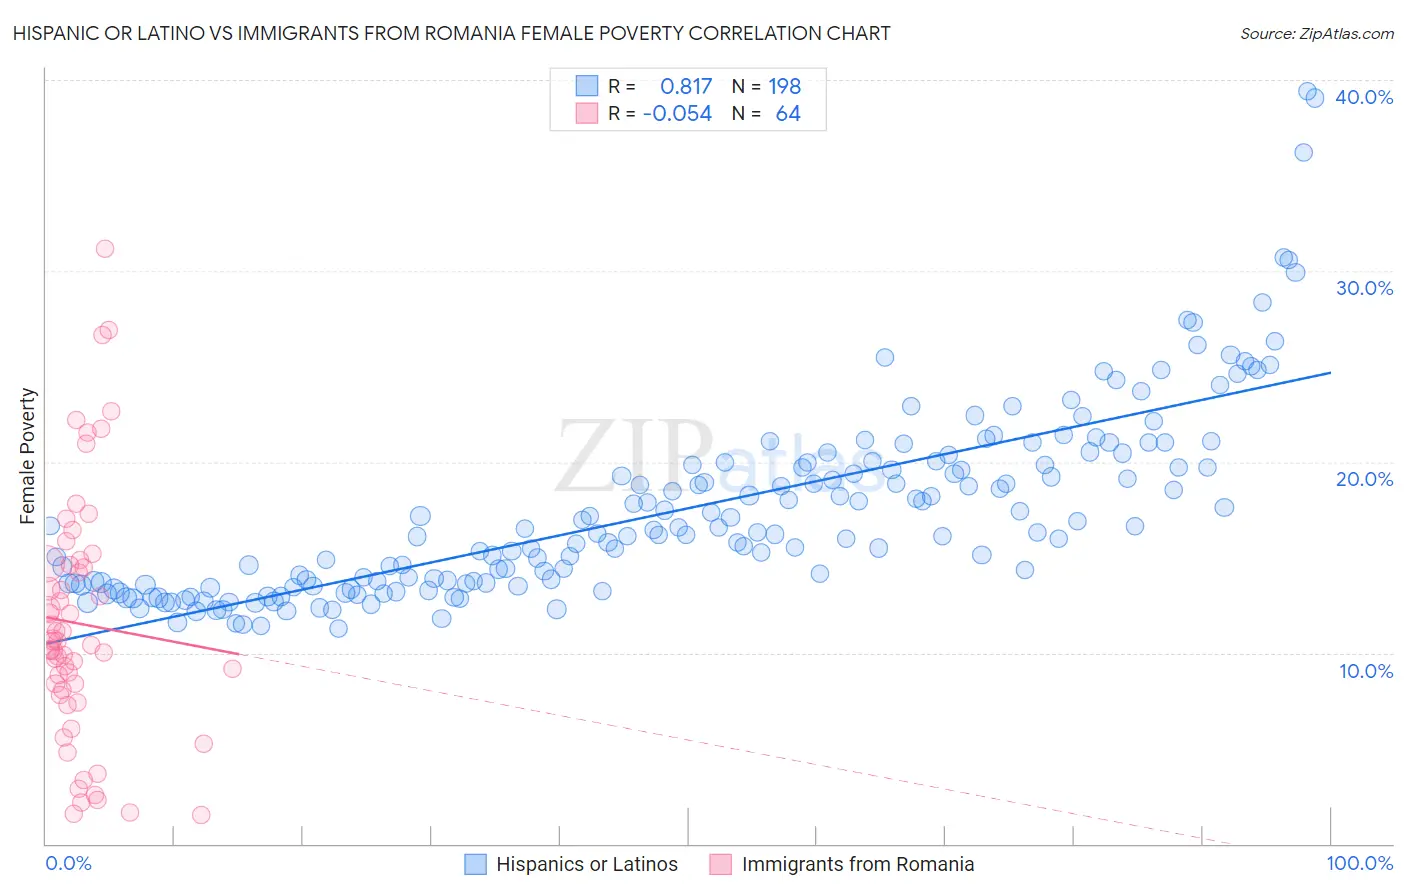
Hispanic or Latino vs Immigrants from Romania Female Poverty Correlation Chart
The statistical analysis conducted on geographies consisting of 574,030,648 people shows a very strong positive correlation between the proportion of Hispanics or Latinos and poverty level among females in the United States with a correlation coefficient (R) of 0.817 and weighted average of 16.6%. Similarly, the statistical analysis conducted on geographies consisting of 256,918,121 people shows a slight negative correlation between the proportion of Immigrants from Romania and poverty level among females in the United States with a correlation coefficient (R) of -0.054 and weighted average of 12.0%, a difference of 39.0%.
Female Poverty Correlation Summary
| Measurement | Hispanic or Latino | Immigrants from Romania |
| Minimum | 11.3% | 1.5% |
| Maximum | 39.4% | 31.2% |
| Range | 28.1% | 29.7% |
| Mean | 17.5% | 11.5% |
| Median | 16.3% | 10.5% |
| Interquartile 25% (IQ1) | 13.6% | 7.9% |
| Interquartile 75% (IQ3) | 19.8% | 14.6% |
| Interquartile Range (IQR) | 6.2% | 6.7% |
| Standard Deviation (Sample) | 5.0% | 6.5% |
| Standard Deviation (Population) | 5.0% | 6.4% |
Similar Demographics by Female Poverty
Demographics Similar to Hispanics or Latinos by Female Poverty
In terms of female poverty, the demographic groups most similar to Hispanics or Latinos are Bahamian (16.6%, a difference of 0.040%), Guatemalan (16.7%, a difference of 0.38%), Chippewa (16.7%, a difference of 0.40%), Somali (16.6%, a difference of 0.52%), and Mexican (16.5%, a difference of 0.73%).
| Demographics | Rating | Rank | Female Poverty |
| Immigrants | Zaire | 0.0 /100 | #292 | Tragic 16.4% |
| Immigrants | Latin America | 0.0 /100 | #293 | Tragic 16.4% |
| Immigrants | Cabo Verde | 0.0 /100 | #294 | Tragic 16.4% |
| Senegalese | 0.0 /100 | #295 | Tragic 16.5% |
| Immigrants | Senegal | 0.0 /100 | #296 | Tragic 16.5% |
| Mexicans | 0.0 /100 | #297 | Tragic 16.5% |
| Somalis | 0.0 /100 | #298 | Tragic 16.6% |
| Hispanics or Latinos | 0.0 /100 | #299 | Tragic 16.6% |
| Bahamians | 0.0 /100 | #300 | Tragic 16.6% |
| Guatemalans | 0.0 /100 | #301 | Tragic 16.7% |
| Chippewa | 0.0 /100 | #302 | Tragic 16.7% |
| Choctaw | 0.0 /100 | #303 | Tragic 16.8% |
| Immigrants | Central America | 0.0 /100 | #304 | Tragic 16.8% |
| Immigrants | Grenada | 0.0 /100 | #305 | Tragic 16.8% |
| Immigrants | Caribbean | 0.0 /100 | #306 | Tragic 16.9% |
Demographics Similar to Immigrants from Romania by Female Poverty
In terms of female poverty, the demographic groups most similar to Immigrants from Romania are Slovene (12.0%, a difference of 0.010%), Immigrants from Japan (11.9%, a difference of 0.19%), Immigrants from Bulgaria (12.0%, a difference of 0.23%), Asian (11.9%, a difference of 0.42%), and Immigrants from Croatia (12.0%, a difference of 0.54%).
| Demographics | Rating | Rank | Female Poverty |
| Immigrants | Moldova | 99.2 /100 | #42 | Exceptional 11.9% |
| Koreans | 99.2 /100 | #43 | Exceptional 11.9% |
| Tongans | 99.2 /100 | #44 | Exceptional 11.9% |
| Immigrants | Czechoslovakia | 99.2 /100 | #45 | Exceptional 11.9% |
| Turks | 99.2 /100 | #46 | Exceptional 11.9% |
| Asians | 99.1 /100 | #47 | Exceptional 11.9% |
| Immigrants | Japan | 99.0 /100 | #48 | Exceptional 11.9% |
| Immigrants | Romania | 99.0 /100 | #49 | Exceptional 12.0% |
| Slovenes | 98.9 /100 | #50 | Exceptional 12.0% |
| Immigrants | Bulgaria | 98.9 /100 | #51 | Exceptional 12.0% |
| Immigrants | Croatia | 98.7 /100 | #52 | Exceptional 12.0% |
| Immigrants | Austria | 98.7 /100 | #53 | Exceptional 12.0% |
| Immigrants | Philippines | 98.7 /100 | #54 | Exceptional 12.1% |
| Immigrants | Sri Lanka | 98.5 /100 | #55 | Exceptional 12.1% |
| Estonians | 98.3 /100 | #56 | Exceptional 12.1% |