Croatian vs Marshallese Female Poverty

COMPARE

Croatian
Race
Ancestry
AfghanAfricanAlaska NativeAlaskan AthabascanAlbanianAleutAlsatianAmericanApacheArabArapahoArgentineanArmenianAssyrian/Chaldean/SyriacAustralianAustrianBahamianBangladeshiBarbadianBasqueBelgianBelizeanBermudanBhutaneseBlackfeetBolivianBrazilianBritishBritish West IndianBulgarianBurmeseCajunCambodianCanadianCape VerdeanCarpatho RusynCelticCentral AmericanCentral American IndianCherokeeCheyenneChickasawChileanChineseChippewaChoctawColombianColvilleComancheCosta RicanCreeCreekCroatianCrowCubanCypriotCzechCzechoslovakianDanishDelawareDominicanDutchDutch West IndianEastern EuropeanEcuadorianEgyptianEnglishEstonianEthiopianEuropeanFijianFilipinoFinnishFrenchFrench American IndianFrench CanadianGermanGerman RussianGhanaianGreekGuamanian/ChamorroGuatemalanGuyaneseHaitianHmongHonduranHopiHoumaHungarianIcelanderIndian (Asian)IndonesianInupiatIranianIraqiIrishIroquoisIsraeliItalianJamaicanJapaneseJordanianKenyanKiowaKoreanLaotianLatvianLebaneseLiberianLithuanianLumbeeLuxembourgerMacedonianMalaysianMalteseMenomineeMexicanMexican American IndianMongolianMoroccanNative HawaiianNavajoNepaleseNew ZealanderNicaraguanNigerianNorthern EuropeanNorwegianOkinawanOsageOttawaPaiutePakistaniPalestinianPanamanianParaguayanPennsylvania GermanPeruvianPimaPolishPortuguesePotawatomiPuebloPuerto RicanPuget Sound SalishRomanianRussianSalvadoranSamoanScandinavianScotch-IrishScottishSeminoleSenegaleseSerbianShoshoneSierra LeoneanSiouxSlavicSlovakSloveneSomaliSouth AfricanSouth AmericanSouth American IndianSoviet UnionSpaniardSpanishSpanish AmericanSpanish American IndianSri LankanSubsaharan AfricanSudaneseSwedishSwissSyrianTaiwaneseThaiTlingit-HaidaTohono O'OdhamTonganTrinidadian and TobagonianTsimshianTurkishU.S. Virgin IslanderUgandanUkrainianUruguayanUteVenezuelanVietnameseWelshWest IndianYakamaYaquiYugoslavianYumanYup'ikZimbabwean
Immigration
NonimmigrantsImmigrantsAfghanistanAfricaAlbaniaArgentinaArmeniaAsiaAustraliaAustriaBahamasBangladeshBarbadosBelarusBelgiumBelizeBoliviaBosnia and HerzegovinaBrazilBulgariaBurma/MyanmarCabo VerdeCambodiaCameroonCanadaCaribbeanCentral AmericaChileChinaColombiaCongoCosta RicaCroatiaCubaCzechoslovakiaDenmarkDominicaDominican RepublicEastern AfricaEastern AsiaEastern EuropeEcuadorEgyptEl SalvadorEnglandEritreaEthiopiaEuropeFijiFranceGermanyGhanaGreeceGrenadaGuatemalaGuyanaHaitiHondurasHong KongHungaryIndiaIndonesiaIranIraqIrelandIsraelItalyJamaicaJapanJordanKazakhstanKenyaKoreaKuwaitLaosLatin AmericaLatviaLebanonLiberiaLithuaniaMalaysiaMexicoMicronesiaMiddle AfricaMoldovaMoroccoNepalNetherlandsNicaraguaNigeriaNorth AmericaNorth MacedoniaNorthern AfricaNorthern EuropeNorwayOceaniaPakistanPanamaPeruPhilippinesPolandPortugalRomaniaRussiaSaudi ArabiaScotlandSenegalSerbiaSierra LeoneSingaporeSomaliaSouth AfricaSouth AmericaSouth Central AsiaSouth Eastern AsiaSouthern EuropeSpainSri LankaSt. Vincent and the GrenadinesSudanSwedenSwitzerlandSyriaTaiwanThailandTrinidad and TobagoTurkeyUgandaUkraineUruguayUzbekistanVenezuelaVietnamWest IndiesWestern AfricaWestern AsiaWestern EuropeYemenZaireZimbabweAzores
Marshallese
Race
Ancestry
AfghanAfricanAlaska NativeAlaskan AthabascanAlbanianAleutAlsatianAmericanApacheArabArapahoArgentineanArmenianAssyrian/Chaldean/SyriacAustralianAustrianBahamianBangladeshiBarbadianBasqueBelgianBelizeanBermudanBhutaneseBlackfeetBolivianBrazilianBritishBritish West IndianBulgarianBurmeseCajunCambodianCanadianCape VerdeanCarpatho RusynCelticCentral AmericanCentral American IndianCherokeeCheyenneChickasawChileanChineseChippewaChoctawColombianColvilleComancheCosta RicanCreeCreekCrowCubanCypriotCzechCzechoslovakianDanishDelawareDominicanDutchDutch West IndianEastern EuropeanEcuadorianEgyptianEnglishEstonianEthiopianEuropeanFijianFilipinoFinnishFrenchFrench American IndianFrench CanadianGermanGerman RussianGhanaianGreekGuamanian/ChamorroGuatemalanGuyaneseHaitianHmongHonduranHopiHoumaHungarianIcelanderIndian (Asian)IndonesianInupiatIranianIraqiIrishIroquoisIsraeliItalianJamaicanJapaneseJordanianKenyanKiowaKoreanLaotianLatvianLebaneseLiberianLithuanianLumbeeLuxembourgerMacedonianMalaysianMalteseMarshalleseMenomineeMexicanMexican American IndianMongolianMoroccanNative HawaiianNavajoNepaleseNew ZealanderNicaraguanNigerianNorthern EuropeanNorwegianOkinawanOsageOttawaPaiutePakistaniPalestinianPanamanianParaguayanPennsylvania GermanPeruvianPimaPolishPortuguesePotawatomiPuebloPuerto RicanPuget Sound SalishRomanianRussianSalvadoranSamoanScandinavianScotch-IrishScottishSeminoleSenegaleseSerbianShoshoneSierra LeoneanSiouxSlavicSlovakSloveneSomaliSouth AfricanSouth AmericanSouth American IndianSoviet UnionSpaniardSpanishSpanish AmericanSpanish American IndianSri LankanSubsaharan AfricanSudaneseSwedishSwissSyrianTaiwaneseThaiTlingit-HaidaTohono O'OdhamTonganTrinidadian and TobagonianTsimshianTurkishU.S. Virgin IslanderUgandanUkrainianUruguayanUteVenezuelanVietnameseWelshWest IndianYakamaYaquiYugoslavianYumanYup'ikZimbabwean
Immigration
NonimmigrantsImmigrantsAfghanistanAfricaAlbaniaArgentinaArmeniaAsiaAustraliaAustriaBahamasBangladeshBarbadosBelarusBelgiumBelizeBoliviaBosnia and HerzegovinaBrazilBulgariaBurma/MyanmarCabo VerdeCambodiaCameroonCanadaCaribbeanCentral AmericaChileChinaColombiaCongoCosta RicaCroatiaCubaCzechoslovakiaDenmarkDominicaDominican RepublicEastern AfricaEastern AsiaEastern EuropeEcuadorEgyptEl SalvadorEnglandEritreaEthiopiaEuropeFijiFranceGermanyGhanaGreeceGrenadaGuatemalaGuyanaHaitiHondurasHong KongHungaryIndiaIndonesiaIranIraqIrelandIsraelItalyJamaicaJapanJordanKazakhstanKenyaKoreaKuwaitLaosLatin AmericaLatviaLebanonLiberiaLithuaniaMalaysiaMexicoMicronesiaMiddle AfricaMoldovaMoroccoNepalNetherlandsNicaraguaNigeriaNorth AmericaNorth MacedoniaNorthern AfricaNorthern EuropeNorwayOceaniaPakistanPanamaPeruPhilippinesPolandPortugalRomaniaRussiaSaudi ArabiaScotlandSenegalSerbiaSierra LeoneSingaporeSomaliaSouth AfricaSouth AmericaSouth Central AsiaSouth Eastern AsiaSouthern EuropeSpainSri LankaSt. Vincent and the GrenadinesSudanSwedenSwitzerlandSyriaTaiwanThailandTrinidad and TobagoTurkeyUgandaUkraineUruguayUzbekistanVenezuelaVietnamWest IndiesWestern AfricaWestern AsiaWestern EuropeYemenZaireZimbabweAzores
Female Poverty
Income
Poverty
Unemployment
Labor Participation
Family Structure
Vehicle Availability
Education Level
Disability

Female Poverty Comparison

Croatians

Marshallese

Exceptional
Tragic
11.6%
FEMALE POVERTY
99.6/ 100
METRIC RATING
26th/ 347
METRIC RANK
14.4%
FEMALE POVERTY
5.0/ 100
METRIC RATING
214th/ 347
METRIC RANK

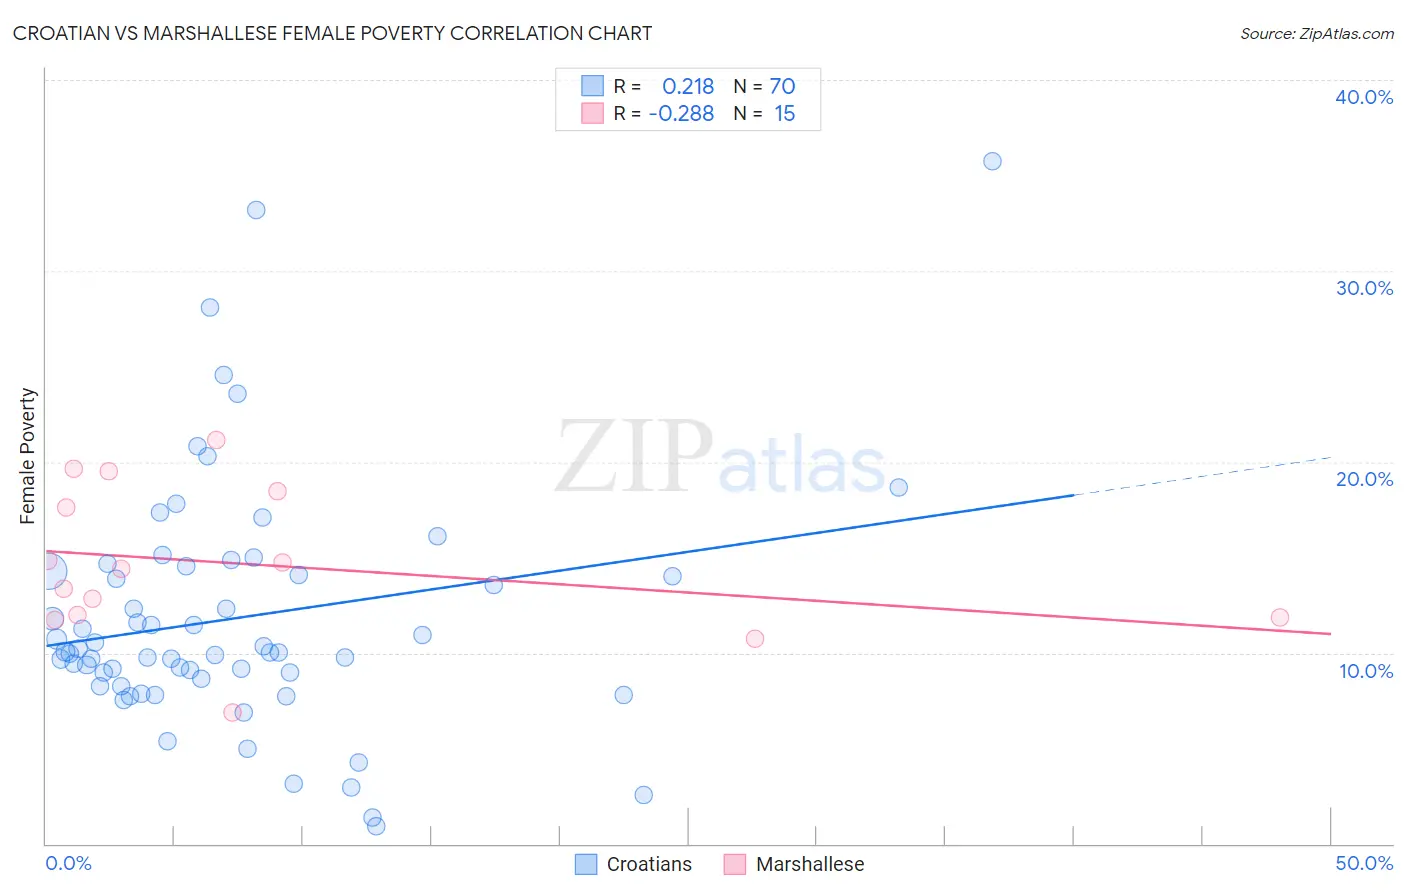
Croatian vs Marshallese Female Poverty Correlation Chart

The statistical analysis conducted on geographies consisting of 375,484,978 people shows a weak positive correlation between the proportion of Croatians and poverty level among females in the United States with a correlation coefficient (R) of 0.218 and weighted average of 11.6%. Similarly, the statistical analysis conducted on geographies consisting of 14,760,991 people shows a weak negative correlation between the proportion of Marshallese and poverty level among females in the United States with a correlation coefficient (R) of -0.288 and weighted average of 14.4%, a difference of 23.7%.
Croatian vs Marshallese Female Poverty

Female Poverty Correlation Summary

MeasurementCroatianMarshallese
Minimum0.92%6.9%
Maximum35.7%21.1%
Range34.8%14.2%
Mean11.8%14.6%
Median10.0%14.4%
Interquartile 25% (IQ1)8.6%11.9%
Interquartile 75% (IQ3)14.2%18.5%
Interquartile Range (IQR)5.6%6.6%
Standard Deviation (Sample)6.4%3.9%
Standard Deviation (Population)6.4%3.8%

Similar Demographics by Female Poverty

Demographics Similar to Croatians by Female Poverty

In terms of female poverty, the demographic groups most similar to Croatians are Immigrants from Northern Europe (11.6%, a difference of 0.0%), Iranian (11.7%, a difference of 0.11%), Luxembourger (11.6%, a difference of 0.27%), Burmese (11.6%, a difference of 0.29%), and Immigrants from Korea (11.7%, a difference of 0.32%).
DemographicsRating | RankFemale Poverty
Norwegians
99.8
/100
|
#19
Exceptional
11.5%
Eastern Europeans
99.7
/100
|
#20
Exceptional
11.5%
Italians
99.7
/100
|
#21
Exceptional
11.6%
Swedes
99.7
/100
|
#22
Exceptional
11.6%
Burmese
99.7
/100
|
#23
Exceptional
11.6%
Luxembourgers
99.7
/100
|
#24
Exceptional
11.6%
Immigrants | Northern Europe
99.6
/100
|
#25
Exceptional
11.6%
Croatians
99.6
/100
|
#26
Exceptional
11.6%
Iranians
99.6
/100
|
#27
Exceptional
11.7%
Immigrants | Korea
99.6
/100
|
#28
Exceptional
11.7%
Immigrants | North Macedonia
99.6
/100
|
#29
Exceptional
11.7%
Greeks
99.5
/100
|
#30
Exceptional
11.7%
Poles
99.5
/100
|
#31
Exceptional
11.7%
Danes
99.5
/100
|
#32
Exceptional
11.7%
Cypriots
99.5
/100
|
#33
Exceptional
11.8%

Demographics Similar to Marshallese by Female Poverty

In terms of female poverty, the demographic groups most similar to Marshallese are Immigrants from Panama (14.4%, a difference of 0.15%), Alaskan Athabascan (14.4%, a difference of 0.16%), Immigrants from Thailand (14.4%, a difference of 0.23%), Bermudan (14.4%, a difference of 0.24%), and Immigrants (14.4%, a difference of 0.27%).
DemographicsRating | RankFemale Poverty
Immigrants | Eastern Africa
9.0
/100
|
#207
Tragic
14.2%
Immigrants | Azores
7.9
/100
|
#208
Tragic
14.2%
Panamanians
7.7
/100
|
#209
Tragic
14.2%
Malaysians
7.4
/100
|
#210
Tragic
14.3%
Moroccans
7.2
/100
|
#211
Tragic
14.3%
Bermudans
5.5
/100
|
#212
Tragic
14.4%
Alaskan Athabascans
5.3
/100
|
#213
Tragic
14.4%
Marshallese
5.0
/100
|
#214
Tragic
14.4%
Immigrants | Panama
4.7
/100
|
#215
Tragic
14.4%
Immigrants | Thailand
4.5
/100
|
#216
Tragic
14.4%
Immigrants | Immigrants
4.5
/100
|
#217
Tragic
14.4%
Immigrants | Uzbekistan
4.4
/100
|
#218
Tragic
14.4%
Japanese
4.1
/100
|
#219
Tragic
14.5%
Alsatians
4.0
/100
|
#220
Tragic
14.5%
Immigrants | Cambodia
3.7
/100
|
#221
Tragic
14.5%