Croatian vs Palestinian Self-Care Disability
COMPARE
Croatian
Palestinian
Self-Care Disability
Self-Care Disability Comparison
Croatians
Palestinians
2.4%
SELF-CARE DISABILITY
95.0/ 100
METRIC RATING
102nd/ 347
METRIC RANK
2.3%
SELF-CARE DISABILITY
99.4/ 100
METRIC RATING
61st/ 347
METRIC RANK
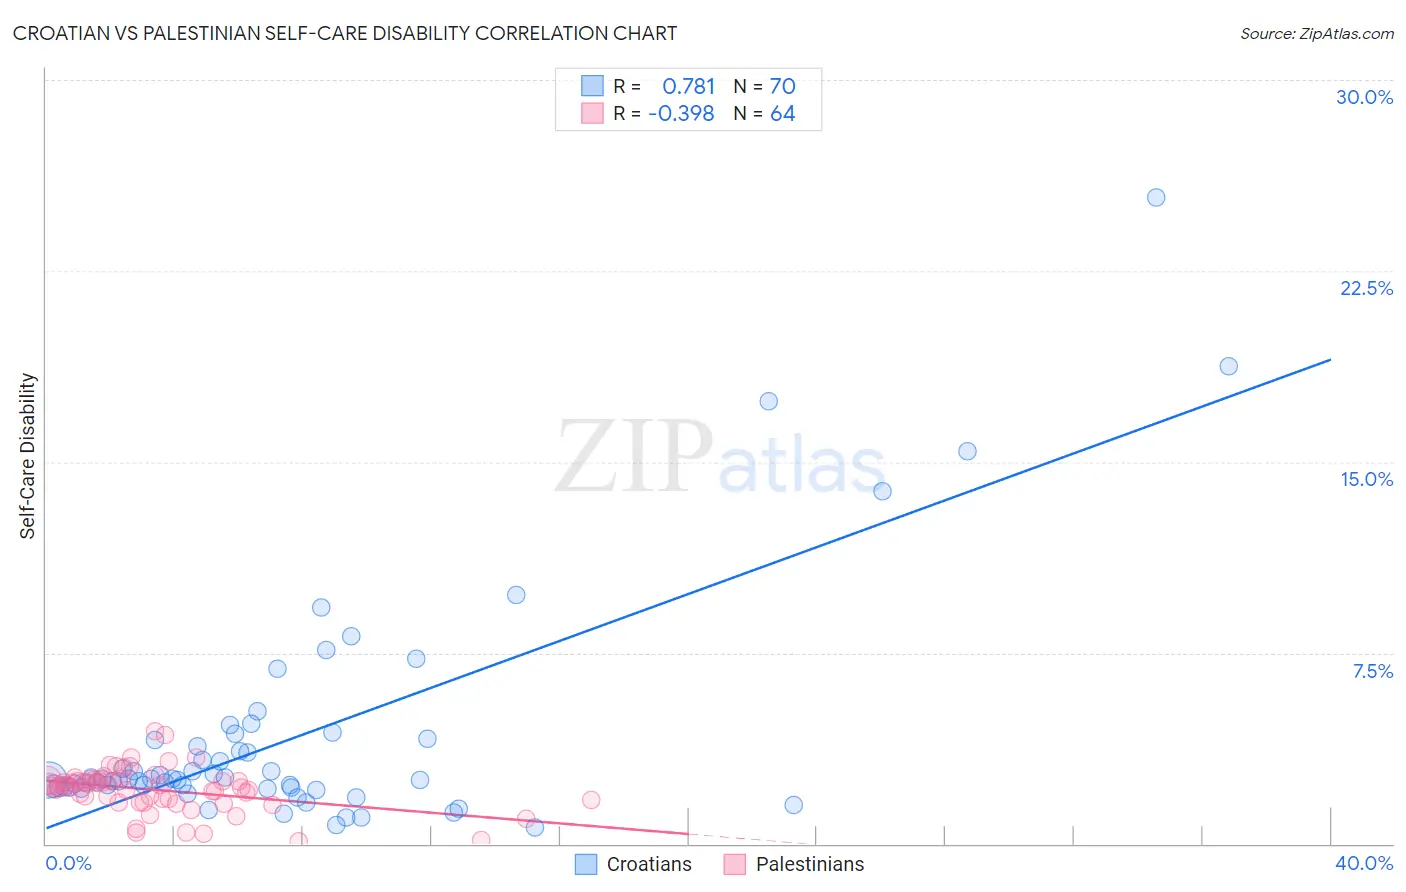
Croatian vs Palestinian Self-Care Disability Correlation Chart
The statistical analysis conducted on geographies consisting of 375,273,101 people shows a strong positive correlation between the proportion of Croatians and percentage of population with self-care disability in the United States with a correlation coefficient (R) of 0.781 and weighted average of 2.4%. Similarly, the statistical analysis conducted on geographies consisting of 216,359,093 people shows a mild negative correlation between the proportion of Palestinians and percentage of population with self-care disability in the United States with a correlation coefficient (R) of -0.398 and weighted average of 2.3%, a difference of 2.8%.
Self-Care Disability Correlation Summary
| Measurement | Croatian | Palestinian |
| Minimum | 0.62% | 0.076% |
| Maximum | 25.4% | 4.4% |
| Range | 24.8% | 4.3% |
| Mean | 4.1% | 2.1% |
| Median | 2.5% | 2.3% |
| Interquartile 25% (IQ1) | 2.2% | 1.7% |
| Interquartile 75% (IQ3) | 4.1% | 2.5% |
| Interquartile Range (IQR) | 1.9% | 0.83% |
| Standard Deviation (Sample) | 4.5% | 0.86% |
| Standard Deviation (Population) | 4.4% | 0.85% |
Similar Demographics by Self-Care Disability
Demographics Similar to Croatians by Self-Care Disability
In terms of self-care disability, the demographic groups most similar to Croatians are Alsatian (2.4%, a difference of 0.030%), Bhutanese (2.4%, a difference of 0.13%), Carpatho Rusyn (2.4%, a difference of 0.17%), Immigrants from Scotland (2.4%, a difference of 0.18%), and Immigrants from Indonesia (2.4%, a difference of 0.18%).
| Demographics | Rating | Rank | Self-Care Disability |
| Immigrants | Asia | 96.9 /100 | #95 | Exceptional 2.4% |
| Immigrants | Chile | 96.7 /100 | #96 | Exceptional 2.4% |
| Swiss | 96.6 /100 | #97 | Exceptional 2.4% |
| Immigrants | Poland | 96.4 /100 | #98 | Exceptional 2.4% |
| Immigrants | Israel | 96.1 /100 | #99 | Exceptional 2.4% |
| Europeans | 95.8 /100 | #100 | Exceptional 2.4% |
| Immigrants | Scotland | 95.7 /100 | #101 | Exceptional 2.4% |
| Croatians | 95.0 /100 | #102 | Exceptional 2.4% |
| Alsatians | 94.9 /100 | #103 | Exceptional 2.4% |
| Bhutanese | 94.5 /100 | #104 | Exceptional 2.4% |
| Carpatho Rusyns | 94.4 /100 | #105 | Exceptional 2.4% |
| Immigrants | Indonesia | 94.3 /100 | #106 | Exceptional 2.4% |
| British | 94.3 /100 | #107 | Exceptional 2.4% |
| Greeks | 94.1 /100 | #108 | Exceptional 2.4% |
| Slovenes | 94.1 /100 | #109 | Exceptional 2.4% |
Demographics Similar to Palestinians by Self-Care Disability
In terms of self-care disability, the demographic groups most similar to Palestinians are Egyptian (2.3%, a difference of 0.090%), Immigrants from Japan (2.3%, a difference of 0.10%), Mongolian (2.3%, a difference of 0.18%), Swedish (2.3%, a difference of 0.18%), and New Zealander (2.3%, a difference of 0.24%).
| Demographics | Rating | Rank | Self-Care Disability |
| Argentineans | 99.6 /100 | #54 | Exceptional 2.3% |
| Immigrants | France | 99.6 /100 | #55 | Exceptional 2.3% |
| Immigrants | Eastern Asia | 99.6 /100 | #56 | Exceptional 2.3% |
| Immigrants | Belgium | 99.6 /100 | #57 | Exceptional 2.3% |
| Immigrants | Cameroon | 99.6 /100 | #58 | Exceptional 2.3% |
| New Zealanders | 99.5 /100 | #59 | Exceptional 2.3% |
| Immigrants | Japan | 99.5 /100 | #60 | Exceptional 2.3% |
| Palestinians | 99.4 /100 | #61 | Exceptional 2.3% |
| Egyptians | 99.4 /100 | #62 | Exceptional 2.3% |
| Mongolians | 99.3 /100 | #63 | Exceptional 2.3% |
| Swedes | 99.3 /100 | #64 | Exceptional 2.3% |
| Brazilians | 99.3 /100 | #65 | Exceptional 2.3% |
| Immigrants | Argentina | 99.3 /100 | #66 | Exceptional 2.3% |
| South Africans | 99.3 /100 | #67 | Exceptional 2.3% |
| Immigrants | Zaire | 99.2 /100 | #68 | Exceptional 2.3% |