Croatian vs Immigrants from Latin America Female Poverty

COMPARE

Croatian
Race
Ancestry
AfghanAfricanAlaska NativeAlaskan AthabascanAlbanianAleutAlsatianAmericanApacheArabArapahoArgentineanArmenianAssyrian/Chaldean/SyriacAustralianAustrianBahamianBangladeshiBarbadianBasqueBelgianBelizeanBermudanBhutaneseBlackfeetBolivianBrazilianBritishBritish West IndianBulgarianBurmeseCajunCambodianCanadianCape VerdeanCarpatho RusynCelticCentral AmericanCentral American IndianCherokeeCheyenneChickasawChileanChineseChippewaChoctawColombianColvilleComancheCosta RicanCreeCreekCroatianCrowCubanCypriotCzechCzechoslovakianDanishDelawareDominicanDutchDutch West IndianEastern EuropeanEcuadorianEgyptianEnglishEstonianEthiopianEuropeanFijianFilipinoFinnishFrenchFrench American IndianFrench CanadianGermanGerman RussianGhanaianGreekGuamanian/ChamorroGuatemalanGuyaneseHaitianHmongHonduranHopiHoumaHungarianIcelanderIndian (Asian)IndonesianInupiatIranianIraqiIrishIroquoisIsraeliItalianJamaicanJapaneseJordanianKenyanKiowaKoreanLaotianLatvianLebaneseLiberianLithuanianLumbeeLuxembourgerMacedonianMalaysianMalteseMarshalleseMenomineeMexicanMexican American IndianMongolianMoroccanNative HawaiianNavajoNepaleseNew ZealanderNicaraguanNigerianNorthern EuropeanNorwegianOkinawanOsageOttawaPaiutePakistaniPalestinianPanamanianParaguayanPennsylvania GermanPeruvianPimaPolishPortuguesePotawatomiPuebloPuerto RicanPuget Sound SalishRomanianRussianSalvadoranSamoanScandinavianScotch-IrishScottishSeminoleSenegaleseSerbianShoshoneSierra LeoneanSiouxSlavicSlovakSloveneSomaliSouth AfricanSouth AmericanSouth American IndianSoviet UnionSpaniardSpanishSpanish AmericanSpanish American IndianSri LankanSubsaharan AfricanSudaneseSwedishSwissSyrianTaiwaneseThaiTlingit-HaidaTohono O'OdhamTonganTrinidadian and TobagonianTsimshianTurkishU.S. Virgin IslanderUgandanUkrainianUruguayanUteVenezuelanVietnameseWelshWest IndianYakamaYaquiYugoslavianYumanYup'ikZimbabwean
Immigration
NonimmigrantsImmigrantsAfghanistanAfricaAlbaniaArgentinaArmeniaAsiaAustraliaAustriaBahamasBangladeshBarbadosBelarusBelgiumBelizeBoliviaBosnia and HerzegovinaBrazilBulgariaBurma/MyanmarCabo VerdeCambodiaCameroonCanadaCaribbeanCentral AmericaChileChinaColombiaCongoCosta RicaCroatiaCubaCzechoslovakiaDenmarkDominicaDominican RepublicEastern AfricaEastern AsiaEastern EuropeEcuadorEgyptEl SalvadorEnglandEritreaEthiopiaEuropeFijiFranceGermanyGhanaGreeceGrenadaGuatemalaGuyanaHaitiHondurasHong KongHungaryIndiaIndonesiaIranIraqIrelandIsraelItalyJamaicaJapanJordanKazakhstanKenyaKoreaKuwaitLaosLatviaLebanonLiberiaLithuaniaMalaysiaMexicoMicronesiaMiddle AfricaMoldovaMoroccoNepalNetherlandsNicaraguaNigeriaNorth AmericaNorth MacedoniaNorthern AfricaNorthern EuropeNorwayOceaniaPakistanPanamaPeruPhilippinesPolandPortugalRomaniaRussiaSaudi ArabiaScotlandSenegalSerbiaSierra LeoneSingaporeSomaliaSouth AfricaSouth AmericaSouth Central AsiaSouth Eastern AsiaSouthern EuropeSpainSri LankaSt. Vincent and the GrenadinesSudanSwedenSwitzerlandSyriaTaiwanThailandTrinidad and TobagoTurkeyUgandaUkraineUruguayUzbekistanVenezuelaVietnamWest IndiesWestern AfricaWestern AsiaWestern EuropeYemenZaireZimbabweAzores
Immigrants from Latin America
Race
Ancestry
AfghanAfricanAlaska NativeAlaskan AthabascanAlbanianAleutAlsatianAmericanApacheArabArapahoArgentineanArmenianAssyrian/Chaldean/SyriacAustralianAustrianBahamianBangladeshiBarbadianBasqueBelgianBelizeanBermudanBhutaneseBlackfeetBolivianBrazilianBritishBritish West IndianBulgarianBurmeseCajunCambodianCanadianCape VerdeanCarpatho RusynCelticCentral AmericanCentral American IndianCherokeeCheyenneChickasawChileanChineseChippewaChoctawColombianColvilleComancheCosta RicanCreeCreekCrowCubanCypriotCzechCzechoslovakianDanishDelawareDominicanDutchDutch West IndianEastern EuropeanEcuadorianEgyptianEnglishEstonianEthiopianEuropeanFijianFilipinoFinnishFrenchFrench American IndianFrench CanadianGermanGerman RussianGhanaianGreekGuamanian/ChamorroGuatemalanGuyaneseHaitianHmongHonduranHopiHoumaHungarianIcelanderIndian (Asian)IndonesianInupiatIranianIraqiIrishIroquoisIsraeliItalianJamaicanJapaneseJordanianKenyanKiowaKoreanLaotianLatvianLebaneseLiberianLithuanianLumbeeLuxembourgerMacedonianMalaysianMalteseMarshalleseMenomineeMexicanMexican American IndianMongolianMoroccanNative HawaiianNavajoNepaleseNew ZealanderNicaraguanNigerianNorthern EuropeanNorwegianOkinawanOsageOttawaPaiutePakistaniPalestinianPanamanianParaguayanPennsylvania GermanPeruvianPimaPolishPortuguesePotawatomiPuebloPuerto RicanPuget Sound SalishRomanianRussianSalvadoranSamoanScandinavianScotch-IrishScottishSeminoleSenegaleseSerbianShoshoneSierra LeoneanSiouxSlavicSlovakSloveneSomaliSouth AfricanSouth AmericanSouth American IndianSoviet UnionSpaniardSpanishSpanish AmericanSpanish American IndianSri LankanSubsaharan AfricanSudaneseSwedishSwissSyrianTaiwaneseThaiTlingit-HaidaTohono O'OdhamTonganTrinidadian and TobagonianTsimshianTurkishU.S. Virgin IslanderUgandanUkrainianUruguayanUteVenezuelanVietnameseWelshWest IndianYakamaYaquiYugoslavianYumanYup'ikZimbabwean
Immigration
NonimmigrantsImmigrantsAfghanistanAfricaAlbaniaArgentinaArmeniaAsiaAustraliaAustriaBahamasBangladeshBarbadosBelarusBelgiumBelizeBoliviaBosnia and HerzegovinaBrazilBulgariaBurma/MyanmarCabo VerdeCambodiaCameroonCanadaCaribbeanCentral AmericaChileChinaColombiaCongoCosta RicaCroatiaCubaCzechoslovakiaDenmarkDominicaDominican RepublicEastern AfricaEastern AsiaEastern EuropeEcuadorEgyptEl SalvadorEnglandEritreaEthiopiaEuropeFijiFranceGermanyGhanaGreeceGrenadaGuatemalaGuyanaHaitiHondurasHong KongHungaryIndiaIndonesiaIranIraqIrelandIsraelItalyJamaicaJapanJordanKazakhstanKenyaKoreaKuwaitLaosLatin AmericaLatviaLebanonLiberiaLithuaniaMalaysiaMexicoMicronesiaMiddle AfricaMoldovaMoroccoNepalNetherlandsNicaraguaNigeriaNorth AmericaNorth MacedoniaNorthern AfricaNorthern EuropeNorwayOceaniaPakistanPanamaPeruPhilippinesPolandPortugalRomaniaRussiaSaudi ArabiaScotlandSenegalSerbiaSierra LeoneSingaporeSomaliaSouth AfricaSouth AmericaSouth Central AsiaSouth Eastern AsiaSouthern EuropeSpainSri LankaSt. Vincent and the GrenadinesSudanSwedenSwitzerlandSyriaTaiwanThailandTrinidad and TobagoTurkeyUgandaUkraineUruguayUzbekistanVenezuelaVietnamWest IndiesWestern AfricaWestern AsiaWestern EuropeYemenZaireZimbabweAzores
Female Poverty
Income
Poverty
Unemployment
Labor Participation
Family Structure
Vehicle Availability
Education Level
Disability

Female Poverty Comparison

Croatians

Immigrants from Latin America

Exceptional
Tragic
11.6%
FEMALE POVERTY
99.6/ 100
METRIC RATING
26th/ 347
METRIC RANK
16.4%
FEMALE POVERTY
0.0/ 100
METRIC RATING
293rd/ 347
METRIC RANK

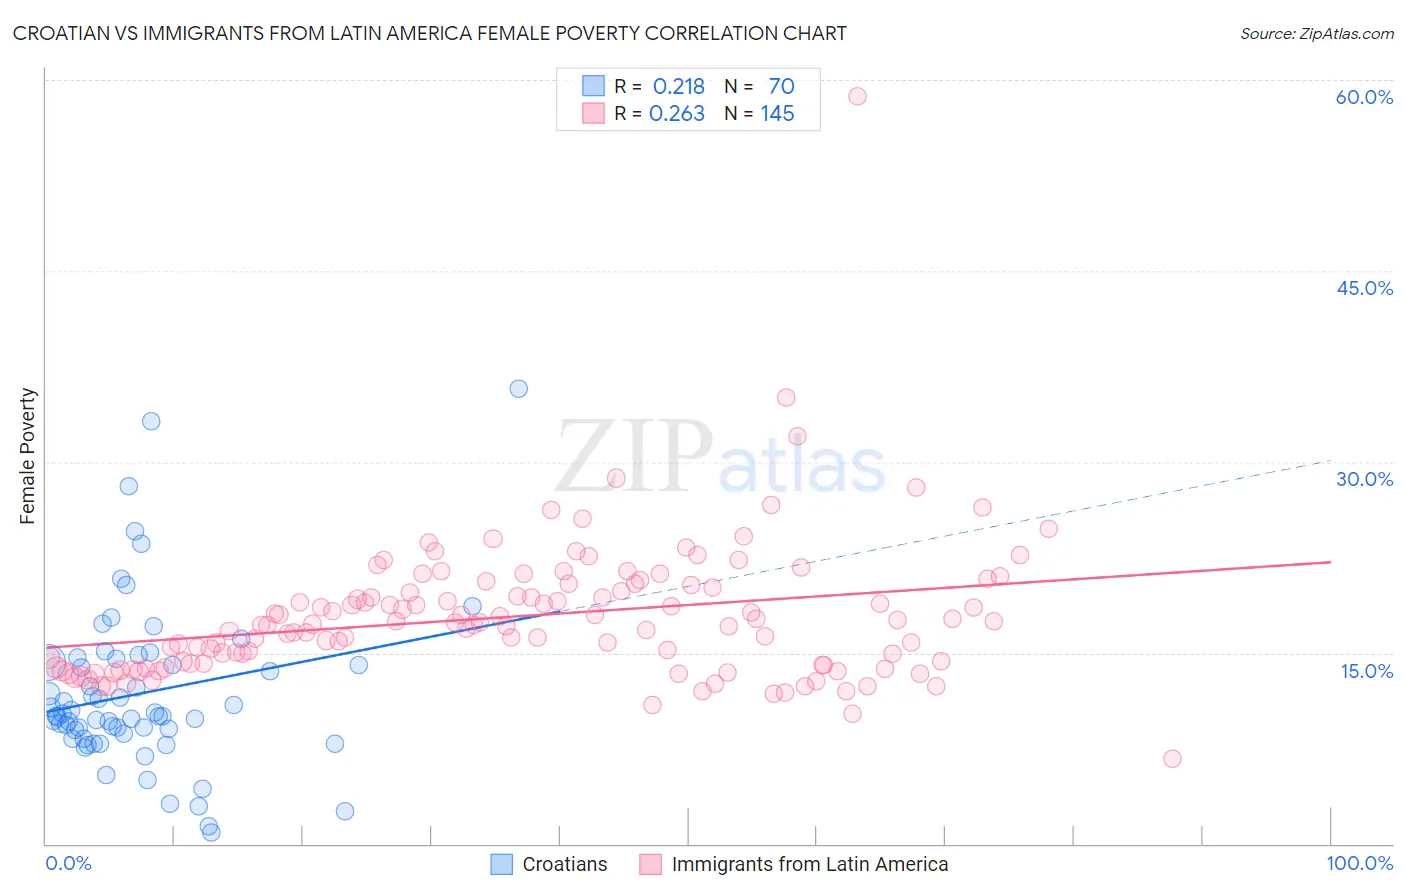
Croatian vs Immigrants from Latin America Female Poverty Correlation Chart

The statistical analysis conducted on geographies consisting of 375,484,978 people shows a weak positive correlation between the proportion of Croatians and poverty level among females in the United States with a correlation coefficient (R) of 0.218 and weighted average of 11.6%. Similarly, the statistical analysis conducted on geographies consisting of 557,630,334 people shows a weak positive correlation between the proportion of Immigrants from Latin America and poverty level among females in the United States with a correlation coefficient (R) of 0.263 and weighted average of 16.4%, a difference of 41.2%.
Croatian vs Immigrants from Latin America Female Poverty

Female Poverty Correlation Summary

MeasurementCroatianImmigrants from Latin America
Minimum0.92%6.7%
Maximum35.7%58.7%
Range34.8%52.1%
Mean11.8%17.9%
Median10.0%17.2%
Interquartile 25% (IQ1)8.6%14.0%
Interquartile 75% (IQ3)14.2%20.2%
Interquartile Range (IQR)5.6%6.2%
Standard Deviation (Sample)6.4%5.5%
Standard Deviation (Population)6.4%5.5%

Similar Demographics by Female Poverty

Demographics Similar to Croatians by Female Poverty

In terms of female poverty, the demographic groups most similar to Croatians are Immigrants from Northern Europe (11.6%, a difference of 0.0%), Iranian (11.7%, a difference of 0.11%), Luxembourger (11.6%, a difference of 0.27%), Burmese (11.6%, a difference of 0.29%), and Immigrants from Korea (11.7%, a difference of 0.32%).
DemographicsRating | RankFemale Poverty
Norwegians
99.8
/100
|
#19
Exceptional
11.5%
Eastern Europeans
99.7
/100
|
#20
Exceptional
11.5%
Italians
99.7
/100
|
#21
Exceptional
11.6%
Swedes
99.7
/100
|
#22
Exceptional
11.6%
Burmese
99.7
/100
|
#23
Exceptional
11.6%
Luxembourgers
99.7
/100
|
#24
Exceptional
11.6%
Immigrants | Northern Europe
99.6
/100
|
#25
Exceptional
11.6%
Croatians
99.6
/100
|
#26
Exceptional
11.6%
Iranians
99.6
/100
|
#27
Exceptional
11.7%
Immigrants | Korea
99.6
/100
|
#28
Exceptional
11.7%
Immigrants | North Macedonia
99.6
/100
|
#29
Exceptional
11.7%
Greeks
99.5
/100
|
#30
Exceptional
11.7%
Poles
99.5
/100
|
#31
Exceptional
11.7%
Danes
99.5
/100
|
#32
Exceptional
11.7%
Cypriots
99.5
/100
|
#33
Exceptional
11.8%

Demographics Similar to Immigrants from Latin America by Female Poverty

In terms of female poverty, the demographic groups most similar to Immigrants from Latin America are Immigrants from Cabo Verde (16.4%, a difference of 0.030%), Immigrants from Zaire (16.4%, a difference of 0.060%), Yaqui (16.4%, a difference of 0.070%), Senegalese (16.5%, a difference of 0.11%), and Immigrants from Senegal (16.5%, a difference of 0.13%).
DemographicsRating | RankFemale Poverty
Inupiat
0.0
/100
|
#286
Tragic
16.2%
Immigrants | Belize
0.0
/100
|
#287
Tragic
16.3%
Indonesians
0.0
/100
|
#288
Tragic
16.4%
Blackfeet
0.0
/100
|
#289
Tragic
16.4%
Immigrants | Bangladesh
0.0
/100
|
#290
Tragic
16.4%
Yaqui
0.0
/100
|
#291
Tragic
16.4%
Immigrants | Zaire
0.0
/100
|
#292
Tragic
16.4%
Immigrants | Latin America
0.0
/100
|
#293
Tragic
16.4%
Immigrants | Cabo Verde
0.0
/100
|
#294
Tragic
16.4%
Senegalese
0.0
/100
|
#295
Tragic
16.5%
Immigrants | Senegal
0.0
/100
|
#296
Tragic
16.5%
Mexicans
0.0
/100
|
#297
Tragic
16.5%
Somalis
0.0
/100
|
#298
Tragic
16.6%
Hispanics or Latinos
0.0
/100
|
#299
Tragic
16.6%
Bahamians
0.0
/100
|
#300
Tragic
16.6%