Creek vs Spanish American Single Male Poverty
COMPARE
Creek
Spanish American
Single Male Poverty
Single Male Poverty Comparison
Creek
Spanish Americans
16.8%
SINGLE MALE POVERTY
0.0/ 100
METRIC RATING
323rd/ 347
METRIC RANK
14.2%
SINGLE MALE POVERTY
0.0/ 100
METRIC RATING
282nd/ 347
METRIC RANK
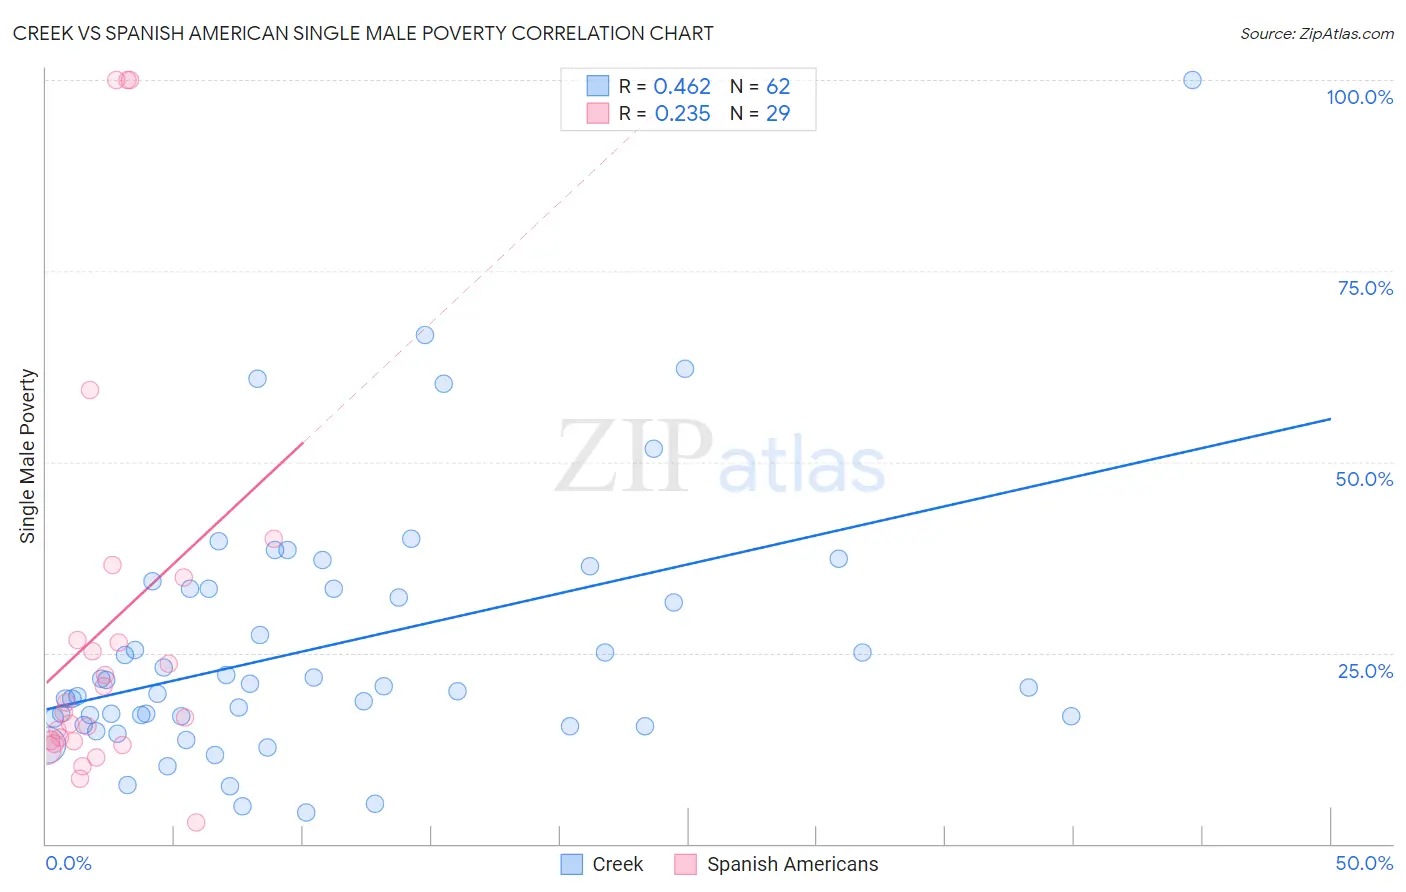
Creek vs Spanish American Single Male Poverty Correlation Chart
The statistical analysis conducted on geographies consisting of 168,159,894 people shows a moderate positive correlation between the proportion of Creek and poverty level among single males in the United States with a correlation coefficient (R) of 0.462 and weighted average of 16.8%. Similarly, the statistical analysis conducted on geographies consisting of 100,269,530 people shows a weak positive correlation between the proportion of Spanish Americans and poverty level among single males in the United States with a correlation coefficient (R) of 0.235 and weighted average of 14.2%, a difference of 18.4%.
Single Male Poverty Correlation Summary
| Measurement | Creek | Spanish American |
| Minimum | 4.0% | 2.8% |
| Maximum | 100.0% | 100.0% |
| Range | 96.0% | 97.2% |
| Mean | 25.8% | 28.5% |
| Median | 20.6% | 17.2% |
| Interquartile 25% (IQ1) | 16.5% | 13.2% |
| Interquartile 75% (IQ3) | 33.3% | 30.7% |
| Interquartile Range (IQR) | 16.9% | 17.5% |
| Standard Deviation (Sample) | 17.0% | 27.2% |
| Standard Deviation (Population) | 16.9% | 26.7% |
Similar Demographics by Single Male Poverty
Demographics Similar to Creek by Single Male Poverty
In terms of single male poverty, the demographic groups most similar to Creek are Immigrants from Yemen (16.9%, a difference of 0.11%), Choctaw (17.0%, a difference of 0.83%), Shoshone (16.7%, a difference of 1.0%), Osage (16.5%, a difference of 2.3%), and Marshallese (16.4%, a difference of 2.4%).
| Demographics | Rating | Rank | Single Male Poverty |
| Dutch West Indians | 0.0 /100 | #316 | Tragic 16.1% |
| Blacks/African Americans | 0.0 /100 | #317 | Tragic 16.2% |
| Chickasaw | 0.0 /100 | #318 | Tragic 16.3% |
| Chippewa | 0.0 /100 | #319 | Tragic 16.4% |
| Marshallese | 0.0 /100 | #320 | Tragic 16.4% |
| Osage | 0.0 /100 | #321 | Tragic 16.5% |
| Shoshone | 0.0 /100 | #322 | Tragic 16.7% |
| Creek | 0.0 /100 | #323 | Tragic 16.8% |
| Immigrants | Yemen | 0.0 /100 | #324 | Tragic 16.9% |
| Choctaw | 0.0 /100 | #325 | Tragic 17.0% |
| Central American Indians | 0.0 /100 | #326 | Tragic 17.2% |
| Menominee | 0.0 /100 | #327 | Tragic 17.7% |
| Kiowa | 0.0 /100 | #328 | Tragic 18.3% |
| Colville | 0.0 /100 | #329 | Tragic 18.4% |
| Cajuns | 0.0 /100 | #330 | Tragic 19.1% |
Demographics Similar to Spanish Americans by Single Male Poverty
In terms of single male poverty, the demographic groups most similar to Spanish Americans are Hispanic or Latino (14.2%, a difference of 0.16%), Yaqui (14.2%, a difference of 0.16%), Hmong (14.2%, a difference of 0.18%), Indonesian (14.1%, a difference of 0.89%), and Slovak (14.1%, a difference of 0.93%).
| Demographics | Rating | Rank | Single Male Poverty |
| English | 0.1 /100 | #275 | Tragic 14.1% |
| Dutch | 0.1 /100 | #276 | Tragic 14.1% |
| Immigrants | Honduras | 0.0 /100 | #277 | Tragic 14.1% |
| Slovaks | 0.0 /100 | #278 | Tragic 14.1% |
| Indonesians | 0.0 /100 | #279 | Tragic 14.1% |
| Hmong | 0.0 /100 | #280 | Tragic 14.2% |
| Hispanics or Latinos | 0.0 /100 | #281 | Tragic 14.2% |
| Spanish Americans | 0.0 /100 | #282 | Tragic 14.2% |
| Yaqui | 0.0 /100 | #283 | Tragic 14.2% |
| Immigrants | Bahamas | 0.0 /100 | #284 | Tragic 14.4% |
| French | 0.0 /100 | #285 | Tragic 14.4% |
| Celtics | 0.0 /100 | #286 | Tragic 14.5% |
| Iroquois | 0.0 /100 | #287 | Tragic 14.5% |
| Whites/Caucasians | 0.0 /100 | #288 | Tragic 14.5% |
| Immigrants | Dominica | 0.0 /100 | #289 | Tragic 14.5% |