Immigrants from Brazil vs Spanish American Single Male Poverty
COMPARE
Immigrants from Brazil
Spanish American
Single Male Poverty
Single Male Poverty Comparison
Immigrants from Brazil
Spanish Americans
11.7%
SINGLE MALE POVERTY
99.8/ 100
METRIC RATING
58th/ 347
METRIC RANK
14.2%
SINGLE MALE POVERTY
0.0/ 100
METRIC RATING
282nd/ 347
METRIC RANK
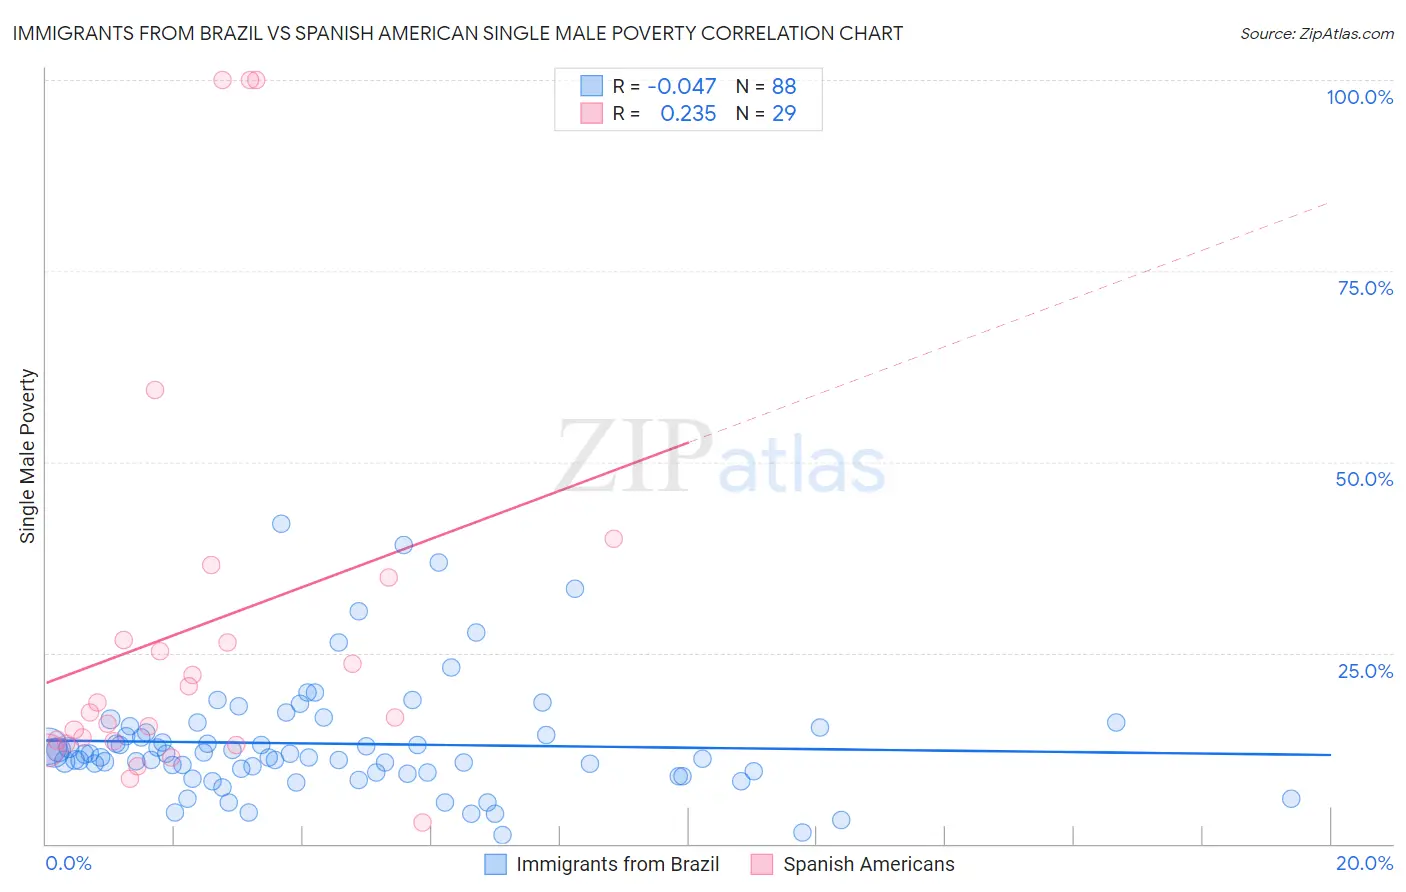
Immigrants from Brazil vs Spanish American Single Male Poverty Correlation Chart
The statistical analysis conducted on geographies consisting of 304,479,372 people shows no correlation between the proportion of Immigrants from Brazil and poverty level among single males in the United States with a correlation coefficient (R) of -0.047 and weighted average of 11.7%. Similarly, the statistical analysis conducted on geographies consisting of 100,269,530 people shows a weak positive correlation between the proportion of Spanish Americans and poverty level among single males in the United States with a correlation coefficient (R) of 0.235 and weighted average of 14.2%, a difference of 21.1%.
Single Male Poverty Correlation Summary
| Measurement | Immigrants from Brazil | Spanish American |
| Minimum | 1.1% | 2.8% |
| Maximum | 41.8% | 100.0% |
| Range | 40.8% | 97.2% |
| Mean | 13.1% | 28.5% |
| Median | 11.5% | 17.2% |
| Interquartile 25% (IQ1) | 9.3% | 13.2% |
| Interquartile 75% (IQ3) | 14.9% | 30.7% |
| Interquartile Range (IQR) | 5.6% | 17.5% |
| Standard Deviation (Sample) | 7.5% | 27.2% |
| Standard Deviation (Population) | 7.5% | 26.7% |
Similar Demographics by Single Male Poverty
Demographics Similar to Immigrants from Brazil by Single Male Poverty
In terms of single male poverty, the demographic groups most similar to Immigrants from Brazil are Immigrants from Romania (11.7%, a difference of 0.020%), Brazilian (11.8%, a difference of 0.080%), Burmese (11.7%, a difference of 0.17%), Peruvian (11.8%, a difference of 0.29%), and Cambodian (11.8%, a difference of 0.32%).
| Demographics | Rating | Rank | Single Male Poverty |
| Paraguayans | 99.9 /100 | #51 | Exceptional 11.6% |
| Samoans | 99.9 /100 | #52 | Exceptional 11.7% |
| Bulgarians | 99.9 /100 | #53 | Exceptional 11.7% |
| Immigrants | Uzbekistan | 99.9 /100 | #54 | Exceptional 11.7% |
| Cypriots | 99.9 /100 | #55 | Exceptional 11.7% |
| Burmese | 99.8 /100 | #56 | Exceptional 11.7% |
| Immigrants | Romania | 99.8 /100 | #57 | Exceptional 11.7% |
| Immigrants | Brazil | 99.8 /100 | #58 | Exceptional 11.7% |
| Brazilians | 99.8 /100 | #59 | Exceptional 11.8% |
| Peruvians | 99.8 /100 | #60 | Exceptional 11.8% |
| Cambodians | 99.8 /100 | #61 | Exceptional 11.8% |
| Immigrants | Sri Lanka | 99.7 /100 | #62 | Exceptional 11.8% |
| Immigrants | Belarus | 99.7 /100 | #63 | Exceptional 11.8% |
| Immigrants | Eastern Europe | 99.6 /100 | #64 | Exceptional 11.8% |
| Laotians | 99.6 /100 | #65 | Exceptional 11.9% |
Demographics Similar to Spanish Americans by Single Male Poverty
In terms of single male poverty, the demographic groups most similar to Spanish Americans are Hispanic or Latino (14.2%, a difference of 0.16%), Yaqui (14.2%, a difference of 0.16%), Hmong (14.2%, a difference of 0.18%), Indonesian (14.1%, a difference of 0.89%), and Slovak (14.1%, a difference of 0.93%).
| Demographics | Rating | Rank | Single Male Poverty |
| English | 0.1 /100 | #275 | Tragic 14.1% |
| Dutch | 0.1 /100 | #276 | Tragic 14.1% |
| Immigrants | Honduras | 0.0 /100 | #277 | Tragic 14.1% |
| Slovaks | 0.0 /100 | #278 | Tragic 14.1% |
| Indonesians | 0.0 /100 | #279 | Tragic 14.1% |
| Hmong | 0.0 /100 | #280 | Tragic 14.2% |
| Hispanics or Latinos | 0.0 /100 | #281 | Tragic 14.2% |
| Spanish Americans | 0.0 /100 | #282 | Tragic 14.2% |
| Yaqui | 0.0 /100 | #283 | Tragic 14.2% |
| Immigrants | Bahamas | 0.0 /100 | #284 | Tragic 14.4% |
| French | 0.0 /100 | #285 | Tragic 14.4% |
| Celtics | 0.0 /100 | #286 | Tragic 14.5% |
| Iroquois | 0.0 /100 | #287 | Tragic 14.5% |
| Whites/Caucasians | 0.0 /100 | #288 | Tragic 14.5% |
| Immigrants | Dominica | 0.0 /100 | #289 | Tragic 14.5% |