Creek vs Finnish Single Male Poverty
COMPARE
Creek
Finnish
Single Male Poverty
Single Male Poverty Comparison
Creek
Finns
16.8%
SINGLE MALE POVERTY
0.0/ 100
METRIC RATING
323rd/ 347
METRIC RANK
13.6%
SINGLE MALE POVERTY
0.9/ 100
METRIC RATING
252nd/ 347
METRIC RANK
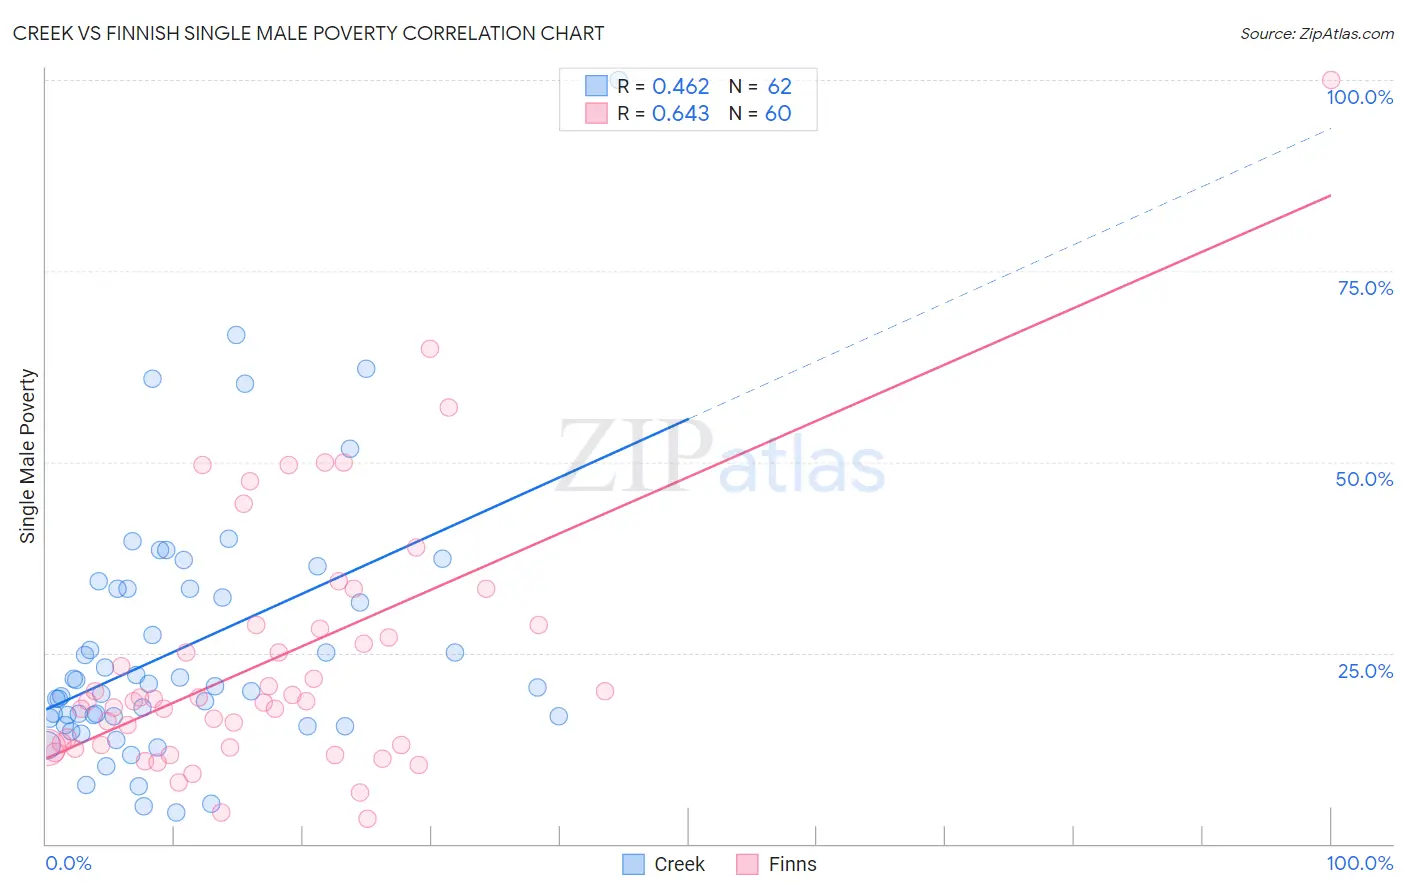
Creek vs Finnish Single Male Poverty Correlation Chart
The statistical analysis conducted on geographies consisting of 168,159,894 people shows a moderate positive correlation between the proportion of Creek and poverty level among single males in the United States with a correlation coefficient (R) of 0.462 and weighted average of 16.8%. Similarly, the statistical analysis conducted on geographies consisting of 351,753,879 people shows a significant positive correlation between the proportion of Finns and poverty level among single males in the United States with a correlation coefficient (R) of 0.643 and weighted average of 13.6%, a difference of 23.9%.
Single Male Poverty Correlation Summary
| Measurement | Creek | Finnish |
| Minimum | 4.0% | 3.3% |
| Maximum | 100.0% | 100.0% |
| Range | 96.0% | 96.7% |
| Mean | 25.8% | 23.9% |
| Median | 20.6% | 18.6% |
| Interquartile 25% (IQ1) | 16.5% | 12.8% |
| Interquartile 75% (IQ3) | 33.3% | 28.3% |
| Interquartile Range (IQR) | 16.9% | 15.6% |
| Standard Deviation (Sample) | 17.0% | 17.0% |
| Standard Deviation (Population) | 16.9% | 16.9% |
Similar Demographics by Single Male Poverty
Demographics Similar to Creek by Single Male Poverty
In terms of single male poverty, the demographic groups most similar to Creek are Immigrants from Yemen (16.9%, a difference of 0.11%), Choctaw (17.0%, a difference of 0.83%), Shoshone (16.7%, a difference of 1.0%), Osage (16.5%, a difference of 2.3%), and Marshallese (16.4%, a difference of 2.4%).
| Demographics | Rating | Rank | Single Male Poverty |
| Dutch West Indians | 0.0 /100 | #316 | Tragic 16.1% |
| Blacks/African Americans | 0.0 /100 | #317 | Tragic 16.2% |
| Chickasaw | 0.0 /100 | #318 | Tragic 16.3% |
| Chippewa | 0.0 /100 | #319 | Tragic 16.4% |
| Marshallese | 0.0 /100 | #320 | Tragic 16.4% |
| Osage | 0.0 /100 | #321 | Tragic 16.5% |
| Shoshone | 0.0 /100 | #322 | Tragic 16.7% |
| Creek | 0.0 /100 | #323 | Tragic 16.8% |
| Immigrants | Yemen | 0.0 /100 | #324 | Tragic 16.9% |
| Choctaw | 0.0 /100 | #325 | Tragic 17.0% |
| Central American Indians | 0.0 /100 | #326 | Tragic 17.2% |
| Menominee | 0.0 /100 | #327 | Tragic 17.7% |
| Kiowa | 0.0 /100 | #328 | Tragic 18.3% |
| Colville | 0.0 /100 | #329 | Tragic 18.4% |
| Cajuns | 0.0 /100 | #330 | Tragic 19.1% |
Demographics Similar to Finns by Single Male Poverty
In terms of single male poverty, the demographic groups most similar to Finns are Immigrants from Zaire (13.6%, a difference of 0.050%), German Russian (13.6%, a difference of 0.14%), Immigrants from Somalia (13.6%, a difference of 0.15%), Spanish (13.6%, a difference of 0.17%), and Czech (13.5%, a difference of 0.41%).
| Demographics | Rating | Rank | Single Male Poverty |
| Immigrants | Latin America | 1.3 /100 | #245 | Tragic 13.5% |
| Immigrants | Micronesia | 1.2 /100 | #246 | Tragic 13.5% |
| Belgians | 1.2 /100 | #247 | Tragic 13.5% |
| Czechs | 1.2 /100 | #248 | Tragic 13.5% |
| Spanish | 1.0 /100 | #249 | Tragic 13.6% |
| Immigrants | Somalia | 1.0 /100 | #250 | Tragic 13.6% |
| Immigrants | Zaire | 0.9 /100 | #251 | Tragic 13.6% |
| Finns | 0.9 /100 | #252 | Tragic 13.6% |
| German Russians | 0.8 /100 | #253 | Tragic 13.6% |
| Sub-Saharan Africans | 0.5 /100 | #254 | Tragic 13.7% |
| Spaniards | 0.4 /100 | #255 | Tragic 13.7% |
| Immigrants | Belize | 0.4 /100 | #256 | Tragic 13.7% |
| Immigrants | Central America | 0.3 /100 | #257 | Tragic 13.8% |
| Immigrants | Guatemala | 0.3 /100 | #258 | Tragic 13.8% |
| Guatemalans | 0.3 /100 | #259 | Tragic 13.8% |