Creek vs Spanish American GED/Equivalency
COMPARE
Creek
Spanish American
GED/Equivalency
GED/Equivalency Comparison
Creek
Spanish Americans
83.6%
GED/EQUIVALENCY
0.7/ 100
METRIC RATING
254th/ 347
METRIC RANK
83.6%
GED/EQUIVALENCY
0.8/ 100
METRIC RATING
251st/ 347
METRIC RANK
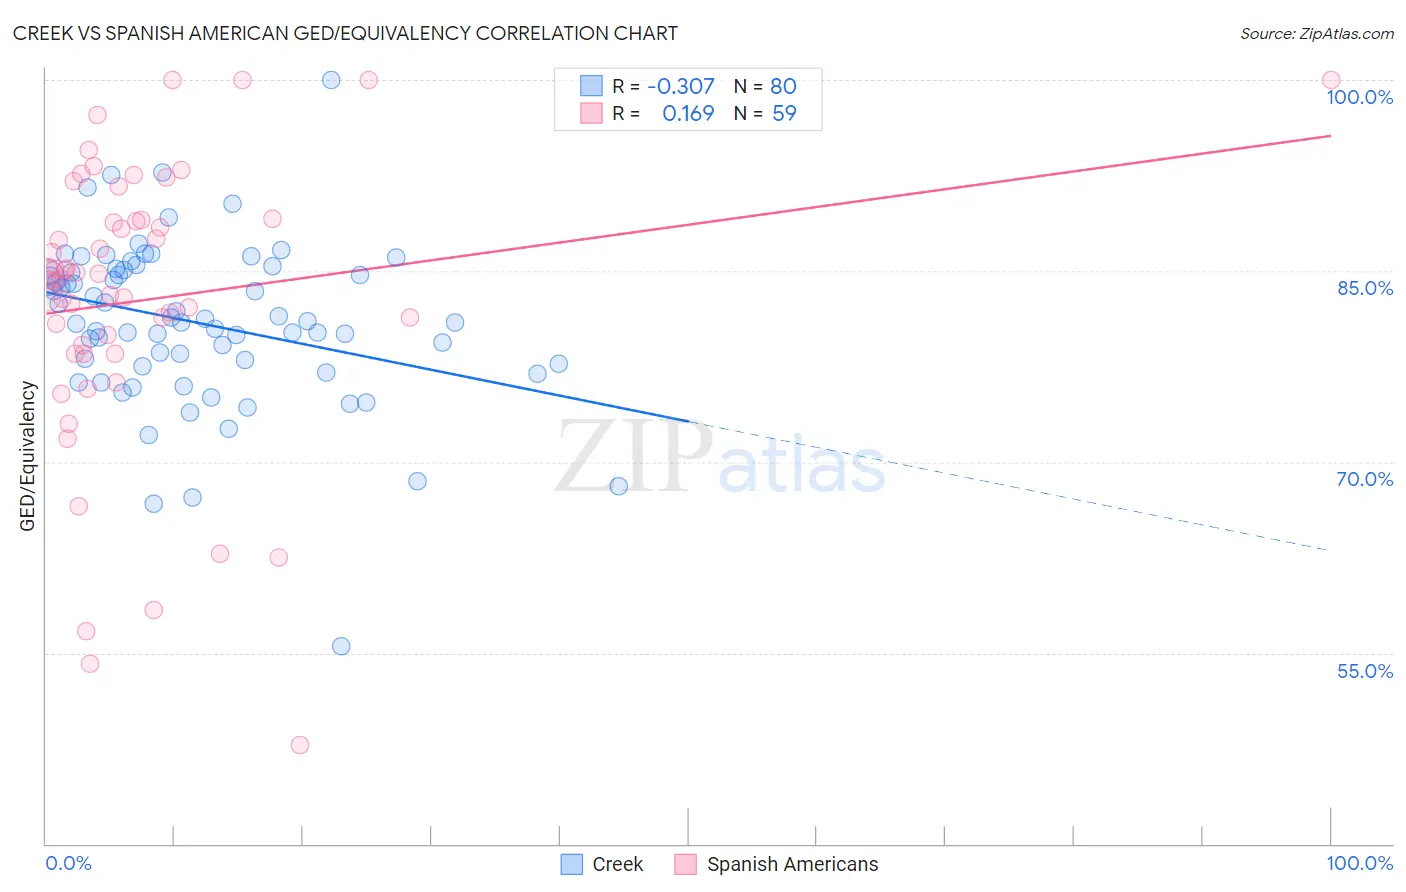
Creek vs Spanish American GED/Equivalency Correlation Chart
The statistical analysis conducted on geographies consisting of 178,480,629 people shows a mild negative correlation between the proportion of Creek and percentage of population with at least ged/equivalency education in the United States with a correlation coefficient (R) of -0.307 and weighted average of 83.6%. Similarly, the statistical analysis conducted on geographies consisting of 103,168,542 people shows a poor positive correlation between the proportion of Spanish Americans and percentage of population with at least ged/equivalency education in the United States with a correlation coefficient (R) of 0.169 and weighted average of 83.6%, a difference of 0.090%.
GED/Equivalency Correlation Summary
| Measurement | Creek | Spanish American |
| Minimum | 55.5% | 47.7% |
| Maximum | 100.0% | 100.0% |
| Range | 44.5% | 52.3% |
| Mean | 80.9% | 82.7% |
| Median | 81.0% | 84.3% |
| Interquartile 25% (IQ1) | 77.6% | 78.5% |
| Interquartile 75% (IQ3) | 84.9% | 89.0% |
| Interquartile Range (IQR) | 7.3% | 10.5% |
| Standard Deviation (Sample) | 6.5% | 11.3% |
| Standard Deviation (Population) | 6.5% | 11.2% |
Demographics Similar to Creek and Spanish Americans by GED/Equivalency
In terms of ged/equivalency, the demographic groups most similar to Creek are Comanche (83.6%, a difference of 0.030%), Bahamian (83.6%, a difference of 0.090%), Colville (83.4%, a difference of 0.17%), African (83.4%, a difference of 0.18%), and Shoshone (83.7%, a difference of 0.24%). Similarly, the demographic groups most similar to Spanish Americans are Bahamian (83.6%, a difference of 0.0%), Comanche (83.6%, a difference of 0.060%), Shoshone (83.7%, a difference of 0.15%), Crow (83.8%, a difference of 0.16%), and Blackfeet (83.8%, a difference of 0.17%).
| Demographics | Rating | Rank | GED/Equivalency |
| Sri Lankans | 1.9 /100 | #242 | Tragic 84.0% |
| Cherokee | 1.3 /100 | #243 | Tragic 83.9% |
| Immigrants | Ghana | 1.3 /100 | #244 | Tragic 83.9% |
| Immigrants | Senegal | 1.2 /100 | #245 | Tragic 83.8% |
| Chickasaw | 1.2 /100 | #246 | Tragic 83.8% |
| Immigrants | Western Africa | 1.1 /100 | #247 | Tragic 83.8% |
| Blackfeet | 1.1 /100 | #248 | Tragic 83.8% |
| Crow | 1.1 /100 | #249 | Tragic 83.8% |
| Shoshone | 1.0 /100 | #250 | Tragic 83.7% |
| Spanish Americans | 0.8 /100 | #251 | Tragic 83.6% |
| Bahamians | 0.8 /100 | #252 | Tragic 83.6% |
| Comanche | 0.7 /100 | #253 | Tragic 83.6% |
| Creek | 0.7 /100 | #254 | Tragic 83.6% |
| Colville | 0.5 /100 | #255 | Tragic 83.4% |
| Africans | 0.5 /100 | #256 | Tragic 83.4% |
| Jamaicans | 0.4 /100 | #257 | Tragic 83.3% |
| Malaysians | 0.4 /100 | #258 | Tragic 83.3% |
| Immigrants | Vietnam | 0.3 /100 | #259 | Tragic 83.2% |
| Choctaw | 0.3 /100 | #260 | Tragic 83.1% |
| Inupiat | 0.2 /100 | #261 | Tragic 83.1% |
| Immigrants | Armenia | 0.2 /100 | #262 | Tragic 83.1% |