Bangladeshi vs Spanish American Single Male Poverty
COMPARE
Bangladeshi
Spanish American
Single Male Poverty
Single Male Poverty Comparison
Bangladeshis
Spanish Americans
13.3%
SINGLE MALE POVERTY
3.7/ 100
METRIC RATING
235th/ 347
METRIC RANK
14.2%
SINGLE MALE POVERTY
0.0/ 100
METRIC RATING
282nd/ 347
METRIC RANK
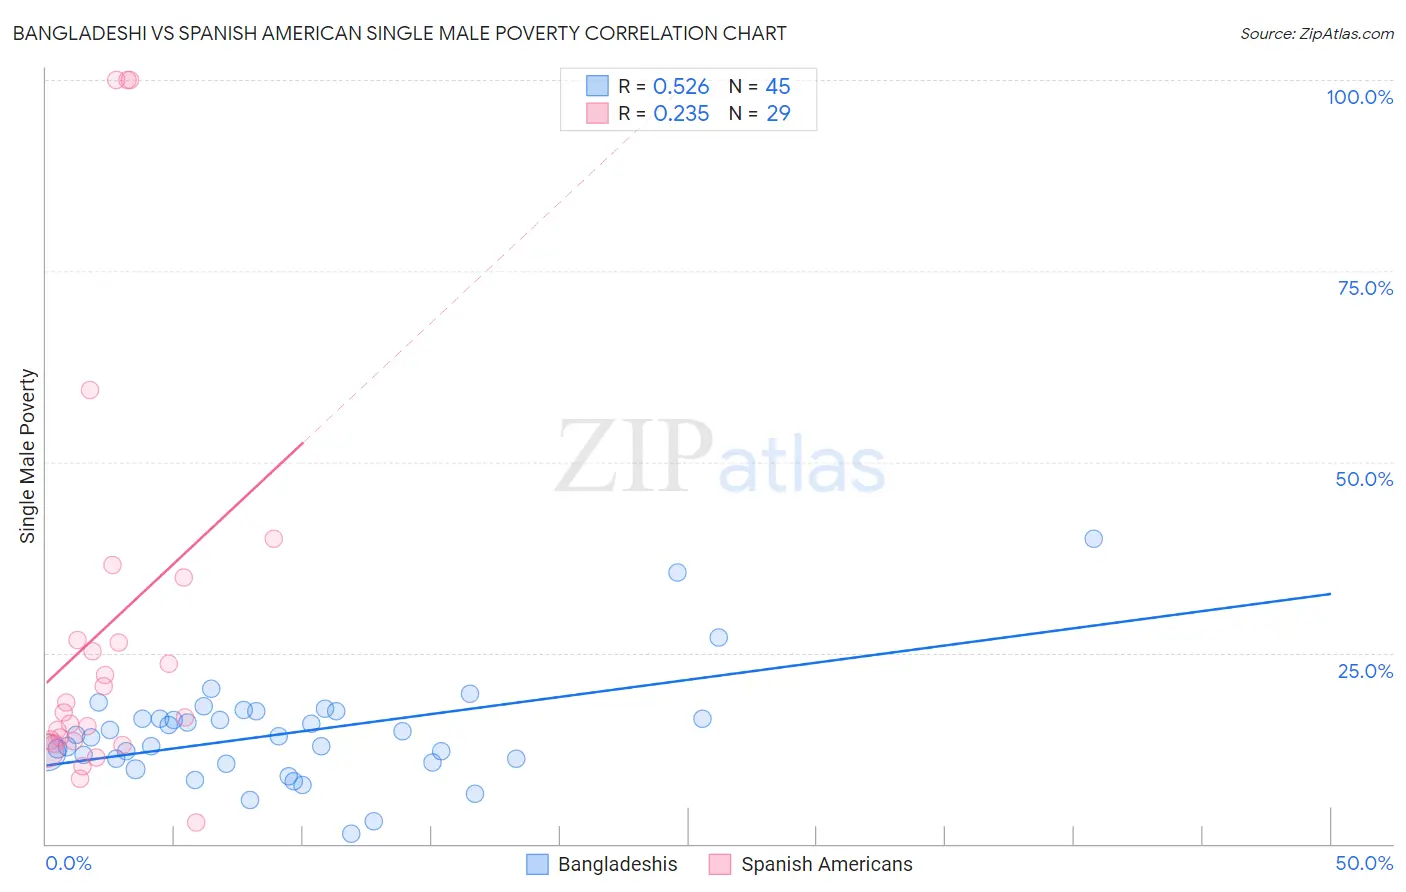
Bangladeshi vs Spanish American Single Male Poverty Correlation Chart
The statistical analysis conducted on geographies consisting of 134,113,248 people shows a substantial positive correlation between the proportion of Bangladeshis and poverty level among single males in the United States with a correlation coefficient (R) of 0.526 and weighted average of 13.3%. Similarly, the statistical analysis conducted on geographies consisting of 100,269,530 people shows a weak positive correlation between the proportion of Spanish Americans and poverty level among single males in the United States with a correlation coefficient (R) of 0.235 and weighted average of 14.2%, a difference of 6.6%.
Single Male Poverty Correlation Summary
| Measurement | Bangladeshi | Spanish American |
| Minimum | 1.3% | 2.8% |
| Maximum | 40.0% | 100.0% |
| Range | 38.7% | 97.2% |
| Mean | 14.5% | 28.5% |
| Median | 14.1% | 17.2% |
| Interquartile 25% (IQ1) | 10.9% | 13.2% |
| Interquartile 75% (IQ3) | 16.9% | 30.7% |
| Interquartile Range (IQR) | 5.9% | 17.5% |
| Standard Deviation (Sample) | 6.9% | 27.2% |
| Standard Deviation (Population) | 6.8% | 26.7% |
Similar Demographics by Single Male Poverty
Demographics Similar to Bangladeshis by Single Male Poverty
In terms of single male poverty, the demographic groups most similar to Bangladeshis are Luxembourger (13.4%, a difference of 0.050%), British (13.3%, a difference of 0.10%), Canadian (13.3%, a difference of 0.10%), British West Indian (13.4%, a difference of 0.11%), and Immigrants from Ghana (13.4%, a difference of 0.21%).
| Demographics | Rating | Rank | Single Male Poverty |
| Lebanese | 6.6 /100 | #228 | Tragic 13.2% |
| Europeans | 6.2 /100 | #229 | Tragic 13.3% |
| Ghanaians | 6.1 /100 | #230 | Tragic 13.3% |
| Slavs | 5.3 /100 | #231 | Tragic 13.3% |
| Immigrants | Caribbean | 5.0 /100 | #232 | Tragic 13.3% |
| British | 4.0 /100 | #233 | Tragic 13.3% |
| Canadians | 4.0 /100 | #234 | Tragic 13.3% |
| Bangladeshis | 3.7 /100 | #235 | Tragic 13.3% |
| Luxembourgers | 3.6 /100 | #236 | Tragic 13.4% |
| British West Indians | 3.4 /100 | #237 | Tragic 13.4% |
| Immigrants | Ghana | 3.2 /100 | #238 | Tragic 13.4% |
| Czechoslovakians | 3.0 /100 | #239 | Tragic 13.4% |
| Belizeans | 2.3 /100 | #240 | Tragic 13.4% |
| Immigrants | Germany | 2.1 /100 | #241 | Tragic 13.4% |
| Carpatho Rusyns | 2.1 /100 | #242 | Tragic 13.4% |
Demographics Similar to Spanish Americans by Single Male Poverty
In terms of single male poverty, the demographic groups most similar to Spanish Americans are Hispanic or Latino (14.2%, a difference of 0.16%), Yaqui (14.2%, a difference of 0.16%), Hmong (14.2%, a difference of 0.18%), Indonesian (14.1%, a difference of 0.89%), and Slovak (14.1%, a difference of 0.93%).
| Demographics | Rating | Rank | Single Male Poverty |
| English | 0.1 /100 | #275 | Tragic 14.1% |
| Dutch | 0.1 /100 | #276 | Tragic 14.1% |
| Immigrants | Honduras | 0.0 /100 | #277 | Tragic 14.1% |
| Slovaks | 0.0 /100 | #278 | Tragic 14.1% |
| Indonesians | 0.0 /100 | #279 | Tragic 14.1% |
| Hmong | 0.0 /100 | #280 | Tragic 14.2% |
| Hispanics or Latinos | 0.0 /100 | #281 | Tragic 14.2% |
| Spanish Americans | 0.0 /100 | #282 | Tragic 14.2% |
| Yaqui | 0.0 /100 | #283 | Tragic 14.2% |
| Immigrants | Bahamas | 0.0 /100 | #284 | Tragic 14.4% |
| French | 0.0 /100 | #285 | Tragic 14.4% |
| Celtics | 0.0 /100 | #286 | Tragic 14.5% |
| Iroquois | 0.0 /100 | #287 | Tragic 14.5% |
| Whites/Caucasians | 0.0 /100 | #288 | Tragic 14.5% |
| Immigrants | Dominica | 0.0 /100 | #289 | Tragic 14.5% |