Creek vs Kiowa Single Male Poverty
COMPARE
Creek
Kiowa
Single Male Poverty
Single Male Poverty Comparison
Creek
Kiowa
16.8%
SINGLE MALE POVERTY
0.0/ 100
METRIC RATING
323rd/ 347
METRIC RANK
18.3%
SINGLE MALE POVERTY
0.0/ 100
METRIC RATING
328th/ 347
METRIC RANK
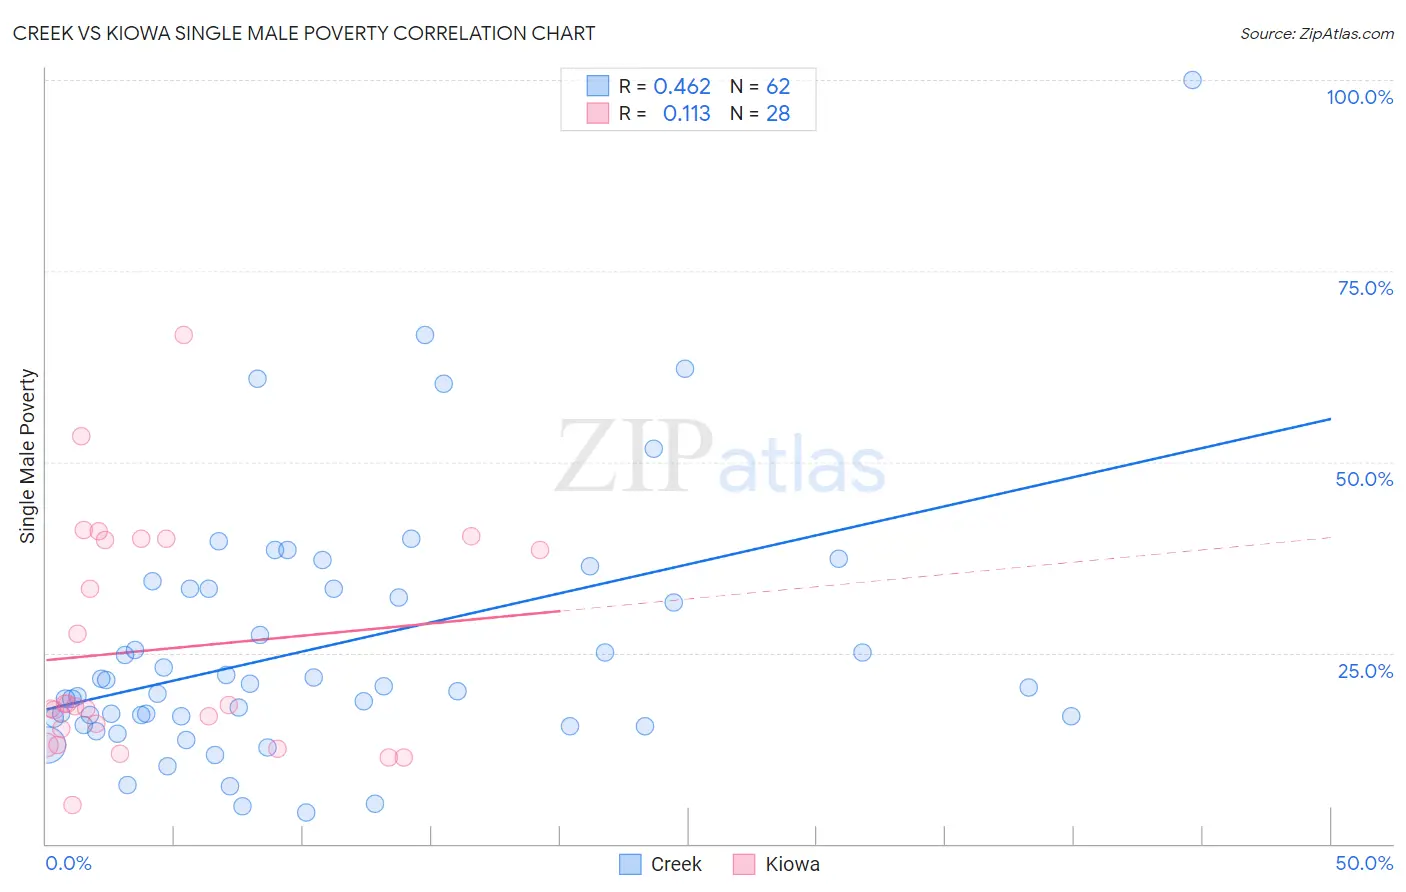
Creek vs Kiowa Single Male Poverty Correlation Chart
The statistical analysis conducted on geographies consisting of 168,159,894 people shows a moderate positive correlation between the proportion of Creek and poverty level among single males in the United States with a correlation coefficient (R) of 0.462 and weighted average of 16.8%. Similarly, the statistical analysis conducted on geographies consisting of 54,682,389 people shows a poor positive correlation between the proportion of Kiowa and poverty level among single males in the United States with a correlation coefficient (R) of 0.113 and weighted average of 18.3%, a difference of 8.7%.
Single Male Poverty Correlation Summary
| Measurement | Creek | Kiowa |
| Minimum | 4.0% | 5.0% |
| Maximum | 100.0% | 66.7% |
| Range | 96.0% | 61.7% |
| Mean | 25.8% | 25.4% |
| Median | 20.6% | 18.1% |
| Interquartile 25% (IQ1) | 16.5% | 14.0% |
| Interquartile 75% (IQ3) | 33.3% | 39.9% |
| Interquartile Range (IQR) | 16.9% | 25.9% |
| Standard Deviation (Sample) | 17.0% | 15.2% |
| Standard Deviation (Population) | 16.9% | 14.9% |
Demographics Similar to Creek and Kiowa by Single Male Poverty
In terms of single male poverty, the demographic groups most similar to Creek are Immigrants from Yemen (16.9%, a difference of 0.11%), Choctaw (17.0%, a difference of 0.83%), Shoshone (16.7%, a difference of 1.0%), Osage (16.5%, a difference of 2.3%), and Marshallese (16.4%, a difference of 2.4%). Similarly, the demographic groups most similar to Kiowa are Colville (18.4%, a difference of 0.73%), Menominee (17.7%, a difference of 3.3%), Cajun (19.1%, a difference of 4.2%), Paiute (19.3%, a difference of 5.4%), and Central American Indian (17.2%, a difference of 6.1%).
| Demographics | Rating | Rank | Single Male Poverty |
| Cheyenne | 0.0 /100 | #315 | Tragic 16.1% |
| Dutch West Indians | 0.0 /100 | #316 | Tragic 16.1% |
| Blacks/African Americans | 0.0 /100 | #317 | Tragic 16.2% |
| Chickasaw | 0.0 /100 | #318 | Tragic 16.3% |
| Chippewa | 0.0 /100 | #319 | Tragic 16.4% |
| Marshallese | 0.0 /100 | #320 | Tragic 16.4% |
| Osage | 0.0 /100 | #321 | Tragic 16.5% |
| Shoshone | 0.0 /100 | #322 | Tragic 16.7% |
| Creek | 0.0 /100 | #323 | Tragic 16.8% |
| Immigrants | Yemen | 0.0 /100 | #324 | Tragic 16.9% |
| Choctaw | 0.0 /100 | #325 | Tragic 17.0% |
| Central American Indians | 0.0 /100 | #326 | Tragic 17.2% |
| Menominee | 0.0 /100 | #327 | Tragic 17.7% |
| Kiowa | 0.0 /100 | #328 | Tragic 18.3% |
| Colville | 0.0 /100 | #329 | Tragic 18.4% |
| Cajuns | 0.0 /100 | #330 | Tragic 19.1% |
| Paiute | 0.0 /100 | #331 | Tragic 19.3% |
| Natives/Alaskans | 0.0 /100 | #332 | Tragic 19.6% |
| Inupiat | 0.0 /100 | #333 | Tragic 20.0% |
| Pima | 0.0 /100 | #334 | Tragic 20.2% |
| Yuman | 0.0 /100 | #335 | Tragic 21.3% |