Comanche vs Lumbee 11th Grade
COMPARE
Comanche
Lumbee
11th Grade
11th Grade Comparison
Comanche
Lumbee
91.7%
11TH GRADE
2.6/ 100
METRIC RATING
238th/ 347
METRIC RANK
88.9%
11TH GRADE
0.0/ 100
METRIC RATING
317th/ 347
METRIC RANK
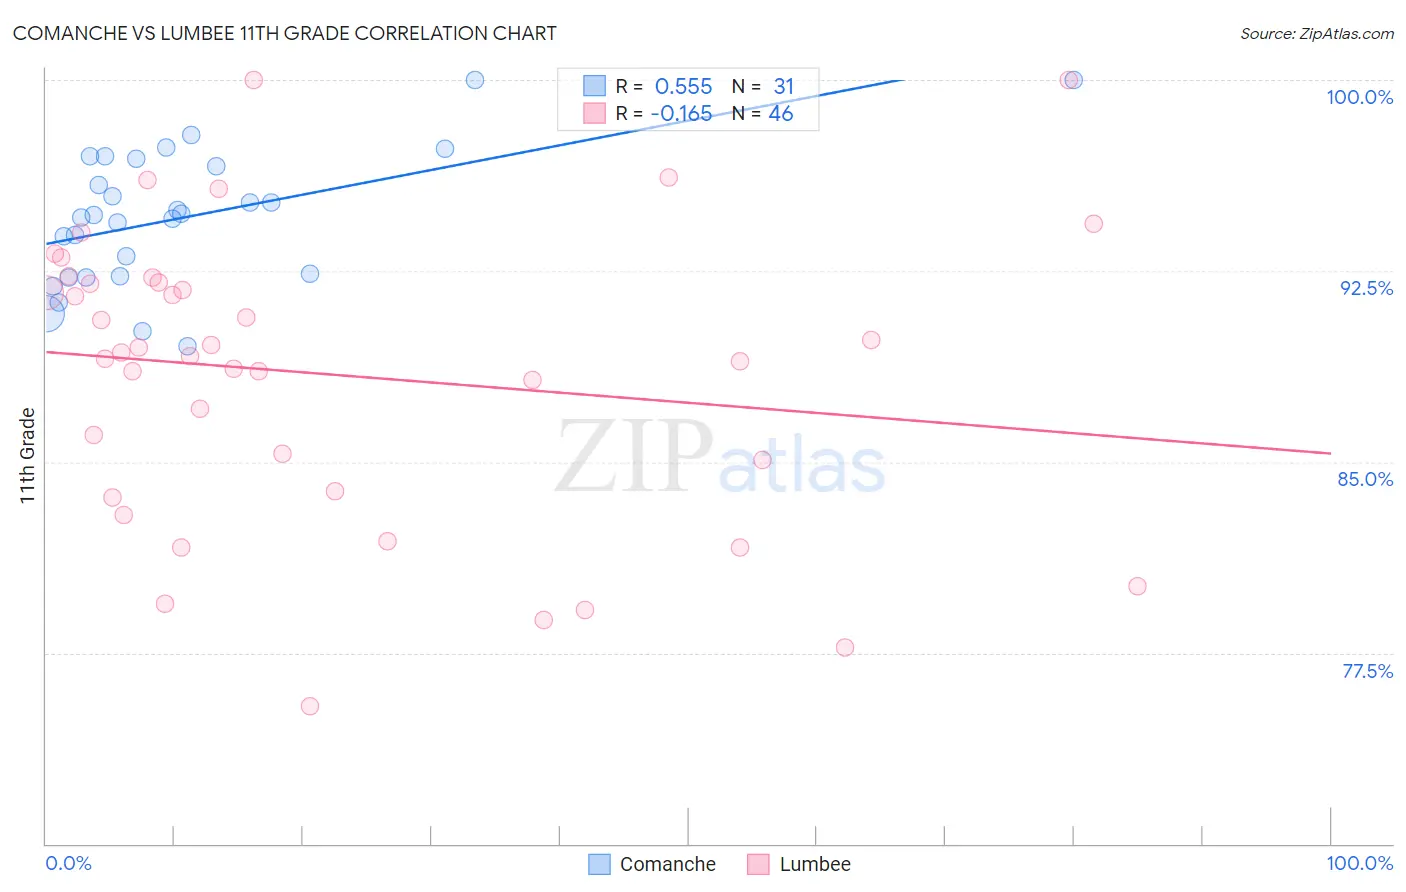
Comanche vs Lumbee 11th Grade Correlation Chart
The statistical analysis conducted on geographies consisting of 109,786,530 people shows a substantial positive correlation between the proportion of Comanche and percentage of population with at least 11th grade education in the United States with a correlation coefficient (R) of 0.555 and weighted average of 91.7%. Similarly, the statistical analysis conducted on geographies consisting of 92,299,068 people shows a poor negative correlation between the proportion of Lumbee and percentage of population with at least 11th grade education in the United States with a correlation coefficient (R) of -0.165 and weighted average of 88.9%, a difference of 3.1%.
11th Grade Correlation Summary
| Measurement | Comanche | Lumbee |
| Minimum | 89.5% | 75.4% |
| Maximum | 100.0% | 100.0% |
| Range | 10.5% | 24.6% |
| Mean | 94.6% | 88.4% |
| Median | 94.7% | 89.2% |
| Interquartile 25% (IQ1) | 92.3% | 83.9% |
| Interquartile 75% (IQ3) | 96.9% | 92.1% |
| Interquartile Range (IQR) | 4.6% | 8.2% |
| Standard Deviation (Sample) | 2.6% | 5.8% |
| Standard Deviation (Population) | 2.6% | 5.7% |
Similar Demographics by 11th Grade
Demographics Similar to Comanche by 11th Grade
In terms of 11th grade, the demographic groups most similar to Comanche are Hopi (91.7%, a difference of 0.0%), Colombian (91.7%, a difference of 0.020%), Immigrants from Bolivia (91.7%, a difference of 0.020%), Armenian (91.7%, a difference of 0.030%), and Subsaharan African (91.7%, a difference of 0.030%).
| Demographics | Rating | Rank | 11th Grade |
| Choctaw | 3.7 /100 | #231 | Tragic 91.8% |
| Uruguayans | 3.5 /100 | #232 | Tragic 91.8% |
| Cheyenne | 3.3 /100 | #233 | Tragic 91.8% |
| Armenians | 2.9 /100 | #234 | Tragic 91.7% |
| Sub-Saharan Africans | 2.9 /100 | #235 | Tragic 91.7% |
| Colombians | 2.8 /100 | #236 | Tragic 91.7% |
| Immigrants | Bolivia | 2.8 /100 | #237 | Tragic 91.7% |
| Comanche | 2.6 /100 | #238 | Tragic 91.7% |
| Hopi | 2.5 /100 | #239 | Tragic 91.7% |
| South Americans | 2.0 /100 | #240 | Tragic 91.6% |
| Bahamians | 1.8 /100 | #241 | Tragic 91.6% |
| Immigrants | Middle Africa | 1.6 /100 | #242 | Tragic 91.6% |
| Immigrants | Thailand | 1.4 /100 | #243 | Tragic 91.6% |
| Senegalese | 1.4 /100 | #244 | Tragic 91.6% |
| Africans | 1.3 /100 | #245 | Tragic 91.5% |
Demographics Similar to Lumbee by 11th Grade
In terms of 11th grade, the demographic groups most similar to Lumbee are Immigrants from Cuba (88.9%, a difference of 0.010%), Nicaraguan (88.9%, a difference of 0.060%), Belizean (88.8%, a difference of 0.15%), Immigrants from Ecuador (89.1%, a difference of 0.16%), and Cape Verdean (89.1%, a difference of 0.17%).
| Demographics | Rating | Rank | 11th Grade |
| Yaqui | 0.0 /100 | #310 | Tragic 89.5% |
| Vietnamese | 0.0 /100 | #311 | Tragic 89.4% |
| Immigrants | Portugal | 0.0 /100 | #312 | Tragic 89.3% |
| Immigrants | Caribbean | 0.0 /100 | #313 | Tragic 89.1% |
| Cape Verdeans | 0.0 /100 | #314 | Tragic 89.1% |
| Immigrants | Ecuador | 0.0 /100 | #315 | Tragic 89.1% |
| Immigrants | Cuba | 0.0 /100 | #316 | Tragic 88.9% |
| Lumbee | 0.0 /100 | #317 | Tragic 88.9% |
| Nicaraguans | 0.0 /100 | #318 | Tragic 88.9% |
| Belizeans | 0.0 /100 | #319 | Tragic 88.8% |
| Immigrants | Armenia | 0.0 /100 | #320 | Tragic 88.8% |
| Immigrants | Belize | 0.0 /100 | #321 | Tragic 88.7% |
| Puerto Ricans | 0.0 /100 | #322 | Tragic 88.4% |
| Pima | 0.0 /100 | #323 | Tragic 88.3% |
| Central American Indians | 0.0 /100 | #324 | Tragic 88.2% |