Comanche vs Syrian Male Poverty
COMPARE
Comanche
Syrian
Male Poverty
Male Poverty Comparison
Comanche
Syrians
13.8%
MALE POVERTY
0.0/ 100
METRIC RATING
283rd/ 347
METRIC RANK
10.9%
MALE POVERTY
71.4/ 100
METRIC RATING
146th/ 347
METRIC RANK
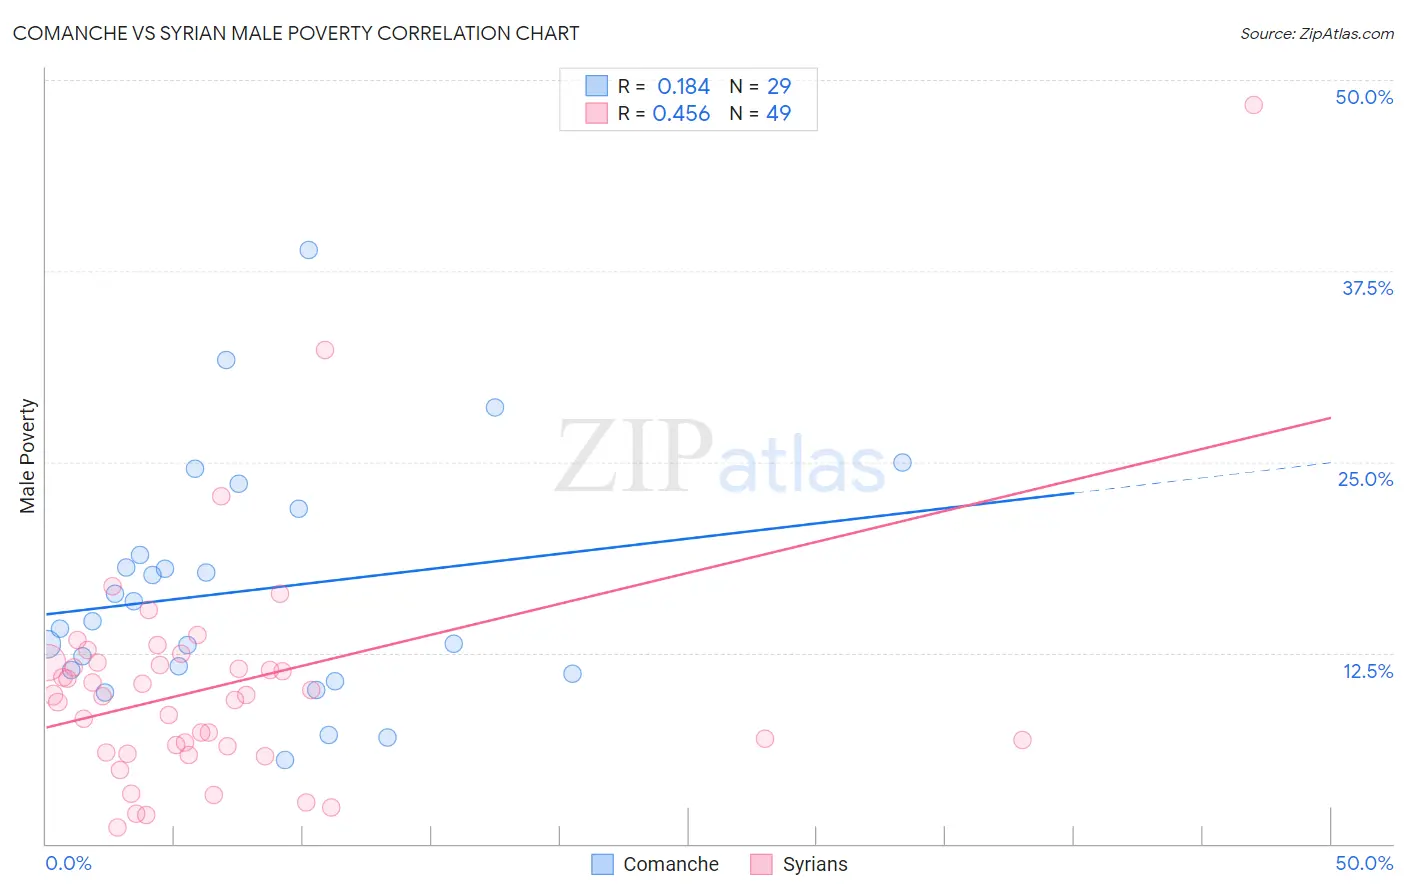
Comanche vs Syrian Male Poverty Correlation Chart
The statistical analysis conducted on geographies consisting of 109,752,173 people shows a poor positive correlation between the proportion of Comanche and poverty level among males in the United States with a correlation coefficient (R) of 0.184 and weighted average of 13.8%. Similarly, the statistical analysis conducted on geographies consisting of 266,155,974 people shows a moderate positive correlation between the proportion of Syrians and poverty level among males in the United States with a correlation coefficient (R) of 0.456 and weighted average of 10.9%, a difference of 25.7%.
Male Poverty Correlation Summary
| Measurement | Comanche | Syrian |
| Minimum | 5.5% | 1.0% |
| Maximum | 38.9% | 48.3% |
| Range | 33.4% | 47.3% |
| Mean | 16.6% | 10.4% |
| Median | 14.6% | 9.7% |
| Interquartile 25% (IQ1) | 11.2% | 6.2% |
| Interquartile 75% (IQ3) | 20.4% | 11.8% |
| Interquartile Range (IQR) | 9.2% | 5.7% |
| Standard Deviation (Sample) | 7.7% | 7.8% |
| Standard Deviation (Population) | 7.6% | 7.7% |
Similar Demographics by Male Poverty
Demographics Similar to Comanche by Male Poverty
In terms of male poverty, the demographic groups most similar to Comanche are Immigrants from Haiti (13.8%, a difference of 0.010%), West Indian (13.8%, a difference of 0.020%), Shoshone (13.8%, a difference of 0.050%), Immigrants from Barbados (13.8%, a difference of 0.070%), and Immigrants from Cabo Verde (13.7%, a difference of 0.20%).
| Demographics | Rating | Rank | Male Poverty |
| Immigrants | Latin America | 0.0 /100 | #276 | Tragic 13.6% |
| Bangladeshis | 0.0 /100 | #277 | Tragic 13.6% |
| Belizeans | 0.0 /100 | #278 | Tragic 13.6% |
| Haitians | 0.0 /100 | #279 | Tragic 13.7% |
| Mexicans | 0.0 /100 | #280 | Tragic 13.7% |
| Yaqui | 0.0 /100 | #281 | Tragic 13.7% |
| Immigrants | Cabo Verde | 0.0 /100 | #282 | Tragic 13.7% |
| Comanche | 0.0 /100 | #283 | Tragic 13.8% |
| Immigrants | Haiti | 0.0 /100 | #284 | Tragic 13.8% |
| West Indians | 0.0 /100 | #285 | Tragic 13.8% |
| Shoshone | 0.0 /100 | #286 | Tragic 13.8% |
| Immigrants | Barbados | 0.0 /100 | #287 | Tragic 13.8% |
| Immigrants | St. Vincent and the Grenadines | 0.0 /100 | #288 | Tragic 13.8% |
| Guatemalans | 0.0 /100 | #289 | Tragic 13.8% |
| Immigrants | Zaire | 0.0 /100 | #290 | Tragic 13.8% |
Demographics Similar to Syrians by Male Poverty
In terms of male poverty, the demographic groups most similar to Syrians are Immigrants from Germany (10.9%, a difference of 0.030%), Samoan (10.9%, a difference of 0.050%), Afghan (10.9%, a difference of 0.070%), Icelander (11.0%, a difference of 0.34%), and Armenian (11.0%, a difference of 0.40%).
| Demographics | Rating | Rank | Male Poverty |
| Immigrants | Jordan | 77.5 /100 | #139 | Good 10.8% |
| Tlingit-Haida | 76.1 /100 | #140 | Good 10.9% |
| Immigrants | France | 75.8 /100 | #141 | Good 10.9% |
| Basques | 74.6 /100 | #142 | Good 10.9% |
| Afghans | 71.9 /100 | #143 | Good 10.9% |
| Samoans | 71.8 /100 | #144 | Good 10.9% |
| Immigrants | Germany | 71.6 /100 | #145 | Good 10.9% |
| Syrians | 71.4 /100 | #146 | Good 10.9% |
| Icelanders | 68.5 /100 | #147 | Good 11.0% |
| Armenians | 68.0 /100 | #148 | Good 11.0% |
| Immigrants | Venezuela | 67.9 /100 | #149 | Good 11.0% |
| Guamanians/Chamorros | 67.6 /100 | #150 | Good 11.0% |
| Venezuelans | 67.4 /100 | #151 | Good 11.0% |
| Immigrants | Nepal | 67.3 /100 | #152 | Good 11.0% |
| Immigrants | Bosnia and Herzegovina | 65.2 /100 | #153 | Good 11.0% |