Comanche vs Immigrants from Belarus Male Poverty
COMPARE
Comanche
Immigrants from Belarus
Male Poverty
Male Poverty Comparison
Comanche
Immigrants from Belarus
13.8%
MALE POVERTY
0.0/ 100
METRIC RATING
283rd/ 347
METRIC RANK
10.7%
MALE POVERTY
83.3/ 100
METRIC RATING
131st/ 347
METRIC RANK
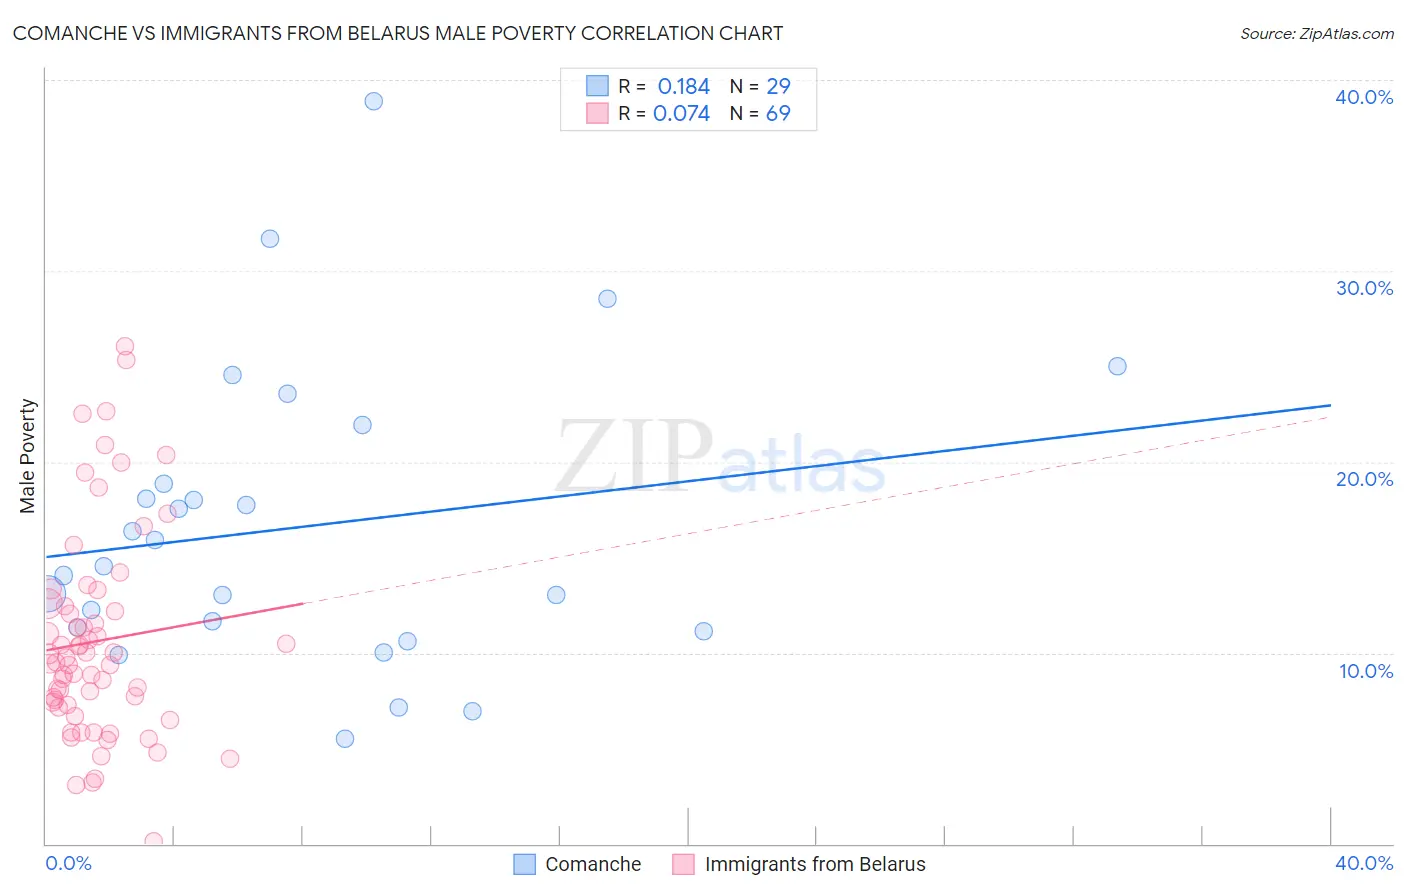
Comanche vs Immigrants from Belarus Male Poverty Correlation Chart
The statistical analysis conducted on geographies consisting of 109,752,173 people shows a poor positive correlation between the proportion of Comanche and poverty level among males in the United States with a correlation coefficient (R) of 0.184 and weighted average of 13.8%. Similarly, the statistical analysis conducted on geographies consisting of 150,164,106 people shows a slight positive correlation between the proportion of Immigrants from Belarus and poverty level among males in the United States with a correlation coefficient (R) of 0.074 and weighted average of 10.7%, a difference of 28.0%.
Male Poverty Correlation Summary
| Measurement | Comanche | Immigrants from Belarus |
| Minimum | 5.5% | 0.12% |
| Maximum | 38.9% | 26.1% |
| Range | 33.4% | 25.9% |
| Mean | 16.6% | 10.6% |
| Median | 14.6% | 9.5% |
| Interquartile 25% (IQ1) | 11.2% | 7.2% |
| Interquartile 75% (IQ3) | 20.4% | 12.5% |
| Interquartile Range (IQR) | 9.2% | 5.3% |
| Standard Deviation (Sample) | 7.7% | 5.5% |
| Standard Deviation (Population) | 7.6% | 5.4% |
Similar Demographics by Male Poverty
Demographics Similar to Comanche by Male Poverty
In terms of male poverty, the demographic groups most similar to Comanche are Immigrants from Haiti (13.8%, a difference of 0.010%), West Indian (13.8%, a difference of 0.020%), Shoshone (13.8%, a difference of 0.050%), Immigrants from Barbados (13.8%, a difference of 0.070%), and Immigrants from Cabo Verde (13.7%, a difference of 0.20%).
| Demographics | Rating | Rank | Male Poverty |
| Immigrants | Latin America | 0.0 /100 | #276 | Tragic 13.6% |
| Bangladeshis | 0.0 /100 | #277 | Tragic 13.6% |
| Belizeans | 0.0 /100 | #278 | Tragic 13.6% |
| Haitians | 0.0 /100 | #279 | Tragic 13.7% |
| Mexicans | 0.0 /100 | #280 | Tragic 13.7% |
| Yaqui | 0.0 /100 | #281 | Tragic 13.7% |
| Immigrants | Cabo Verde | 0.0 /100 | #282 | Tragic 13.7% |
| Comanche | 0.0 /100 | #283 | Tragic 13.8% |
| Immigrants | Haiti | 0.0 /100 | #284 | Tragic 13.8% |
| West Indians | 0.0 /100 | #285 | Tragic 13.8% |
| Shoshone | 0.0 /100 | #286 | Tragic 13.8% |
| Immigrants | Barbados | 0.0 /100 | #287 | Tragic 13.8% |
| Immigrants | St. Vincent and the Grenadines | 0.0 /100 | #288 | Tragic 13.8% |
| Guatemalans | 0.0 /100 | #289 | Tragic 13.8% |
| Immigrants | Zaire | 0.0 /100 | #290 | Tragic 13.8% |
Demographics Similar to Immigrants from Belarus by Male Poverty
In terms of male poverty, the demographic groups most similar to Immigrants from Belarus are Immigrants from Vietnam (10.8%, a difference of 0.050%), Pakistani (10.8%, a difference of 0.060%), New Zealander (10.8%, a difference of 0.070%), Chilean (10.7%, a difference of 0.11%), and Brazilian (10.8%, a difference of 0.11%).
| Demographics | Rating | Rank | Male Poverty |
| French | 86.7 /100 | #124 | Excellent 10.7% |
| Immigrants | Norway | 86.0 /100 | #125 | Excellent 10.7% |
| Immigrants | Ukraine | 84.3 /100 | #126 | Excellent 10.7% |
| Puget Sound Salish | 84.3 /100 | #127 | Excellent 10.7% |
| Immigrants | Western Europe | 84.2 /100 | #128 | Excellent 10.7% |
| Immigrants | Peru | 84.1 /100 | #129 | Excellent 10.7% |
| Chileans | 83.9 /100 | #130 | Excellent 10.7% |
| Immigrants | Belarus | 83.3 /100 | #131 | Excellent 10.7% |
| Immigrants | Vietnam | 83.0 /100 | #132 | Excellent 10.8% |
| Pakistanis | 83.0 /100 | #133 | Excellent 10.8% |
| New Zealanders | 82.9 /100 | #134 | Excellent 10.8% |
| Brazilians | 82.7 /100 | #135 | Excellent 10.8% |
| Immigrants | Israel | 80.9 /100 | #136 | Excellent 10.8% |
| Immigrants | Switzerland | 79.2 /100 | #137 | Good 10.8% |
| Yugoslavians | 78.2 /100 | #138 | Good 10.8% |