Comanche vs Immigrants from Panama Poverty
COMPARE
Comanche
Immigrants from Panama
Poverty
Poverty Comparison
Comanche
Immigrants from Panama
15.0%
POVERTY
0.0/ 100
METRIC RATING
282nd/ 347
METRIC RANK
13.3%
POVERTY
4.1/ 100
METRIC RATING
213th/ 347
METRIC RANK
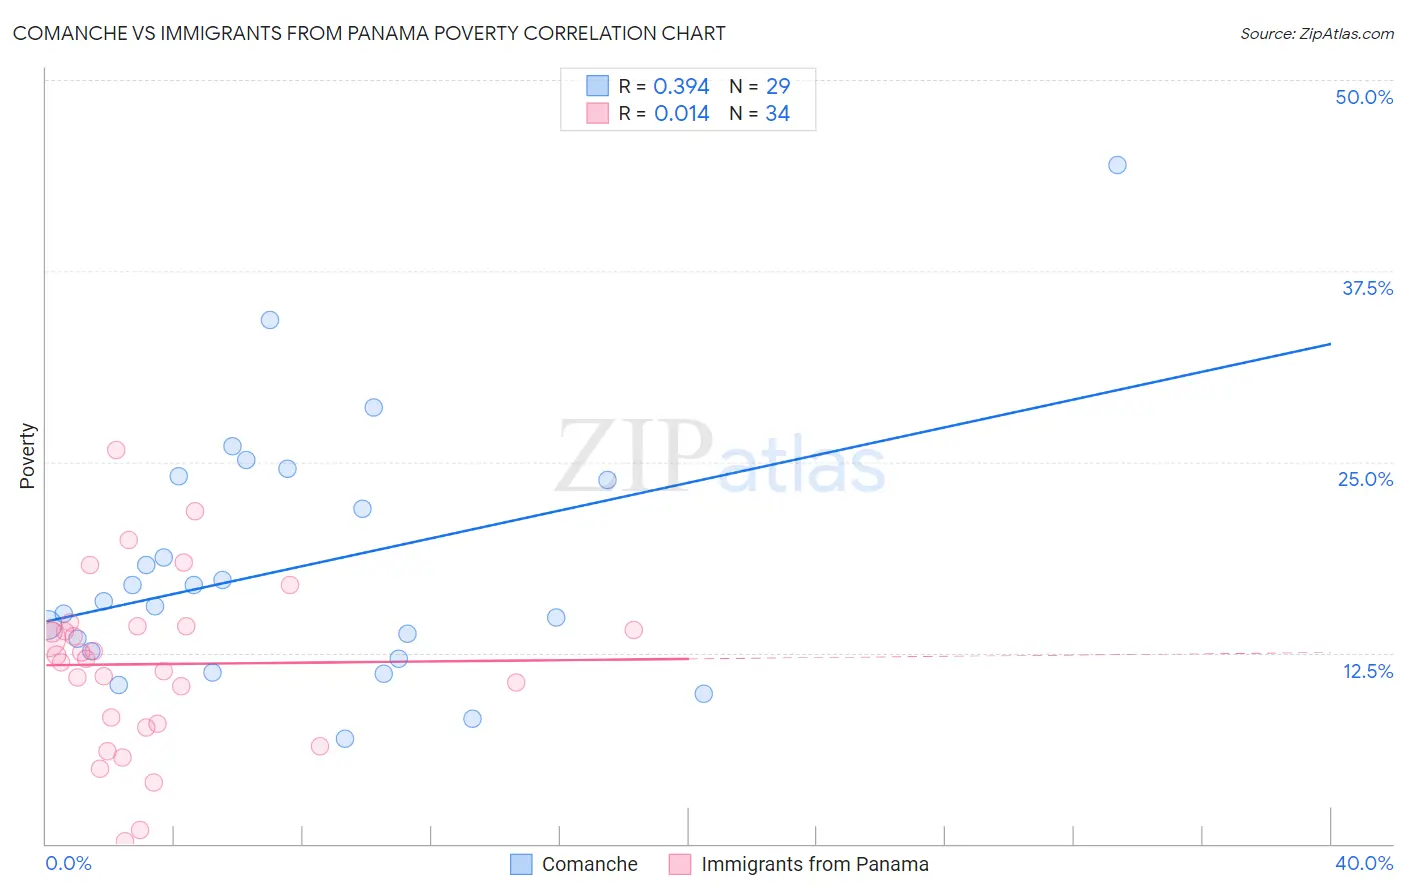
Comanche vs Immigrants from Panama Poverty Correlation Chart
The statistical analysis conducted on geographies consisting of 109,758,867 people shows a mild positive correlation between the proportion of Comanche and poverty level in the United States with a correlation coefficient (R) of 0.394 and weighted average of 15.0%. Similarly, the statistical analysis conducted on geographies consisting of 221,154,793 people shows no correlation between the proportion of Immigrants from Panama and poverty level in the United States with a correlation coefficient (R) of 0.014 and weighted average of 13.3%, a difference of 12.8%.
Poverty Correlation Summary
| Measurement | Comanche | Immigrants from Panama |
| Minimum | 6.8% | 0.14% |
| Maximum | 44.4% | 25.8% |
| Range | 37.6% | 25.7% |
| Mean | 18.1% | 11.8% |
| Median | 15.9% | 12.2% |
| Interquartile 25% (IQ1) | 12.4% | 7.9% |
| Interquartile 75% (IQ3) | 24.0% | 14.2% |
| Interquartile Range (IQR) | 11.6% | 6.4% |
| Standard Deviation (Sample) | 8.3% | 5.6% |
| Standard Deviation (Population) | 8.1% | 5.5% |
Similar Demographics by Poverty
Demographics Similar to Comanche by Poverty
In terms of poverty, the demographic groups most similar to Comanche are Immigrants from Haiti (15.0%, a difference of 0.12%), West Indian (15.0%, a difference of 0.23%), Vietnamese (15.0%, a difference of 0.28%), Immigrants from Barbados (14.9%, a difference of 0.33%), and Haitian (14.9%, a difference of 0.40%).
| Demographics | Rating | Rank | Poverty |
| Immigrants | West Indies | 0.0 /100 | #275 | Tragic 14.8% |
| Immigrants | Bahamas | 0.0 /100 | #276 | Tragic 14.8% |
| Bangladeshis | 0.0 /100 | #277 | Tragic 14.8% |
| Belizeans | 0.0 /100 | #278 | Tragic 14.8% |
| Immigrants | St. Vincent and the Grenadines | 0.0 /100 | #279 | Tragic 14.9% |
| Haitians | 0.0 /100 | #280 | Tragic 14.9% |
| Immigrants | Barbados | 0.0 /100 | #281 | Tragic 14.9% |
| Comanche | 0.0 /100 | #282 | Tragic 15.0% |
| Immigrants | Haiti | 0.0 /100 | #283 | Tragic 15.0% |
| West Indians | 0.0 /100 | #284 | Tragic 15.0% |
| Vietnamese | 0.0 /100 | #285 | Tragic 15.0% |
| Immigrants | Latin America | 0.0 /100 | #286 | Tragic 15.0% |
| Inupiat | 0.0 /100 | #287 | Tragic 15.1% |
| Yaqui | 0.0 /100 | #288 | Tragic 15.1% |
| Immigrants | Belize | 0.0 /100 | #289 | Tragic 15.1% |
Demographics Similar to Immigrants from Panama by Poverty
In terms of poverty, the demographic groups most similar to Immigrants from Panama are Immigrants (13.2%, a difference of 0.13%), Bermudan (13.3%, a difference of 0.25%), Japanese (13.3%, a difference of 0.51%), Nonimmigrants (13.3%, a difference of 0.51%), and Immigrants from Uzbekistan (13.3%, a difference of 0.55%).
| Demographics | Rating | Rank | Poverty |
| Immigrants | Eastern Africa | 7.0 /100 | #206 | Tragic 13.1% |
| Panamanians | 6.6 /100 | #207 | Tragic 13.1% |
| Ugandans | 6.2 /100 | #208 | Tragic 13.1% |
| Malaysians | 6.1 /100 | #209 | Tragic 13.1% |
| Immigrants | Azores | 6.1 /100 | #210 | Tragic 13.1% |
| Moroccans | 5.2 /100 | #211 | Tragic 13.2% |
| Immigrants | Immigrants | 4.3 /100 | #212 | Tragic 13.2% |
| Immigrants | Panama | 4.1 /100 | #213 | Tragic 13.3% |
| Bermudans | 3.7 /100 | #214 | Tragic 13.3% |
| Japanese | 3.3 /100 | #215 | Tragic 13.3% |
| Immigrants | Nonimmigrants | 3.3 /100 | #216 | Tragic 13.3% |
| Immigrants | Uzbekistan | 3.2 /100 | #217 | Tragic 13.3% |
| Immigrants | Thailand | 3.1 /100 | #218 | Tragic 13.3% |
| Immigrants | Cambodia | 3.0 /100 | #219 | Tragic 13.4% |
| Americans | 2.9 /100 | #220 | Tragic 13.4% |