Northern European vs Immigrants from Micronesia Single Female Poverty
COMPARE
Northern European
Immigrants from Micronesia
Single Female Poverty
Single Female Poverty Comparison
Northern Europeans
Immigrants from Micronesia
20.8%
SINGLE FEMALE POVERTY
68.4/ 100
METRIC RATING
162nd/ 347
METRIC RANK
23.0%
SINGLE FEMALE POVERTY
0.2/ 100
METRIC RATING
266th/ 347
METRIC RANK
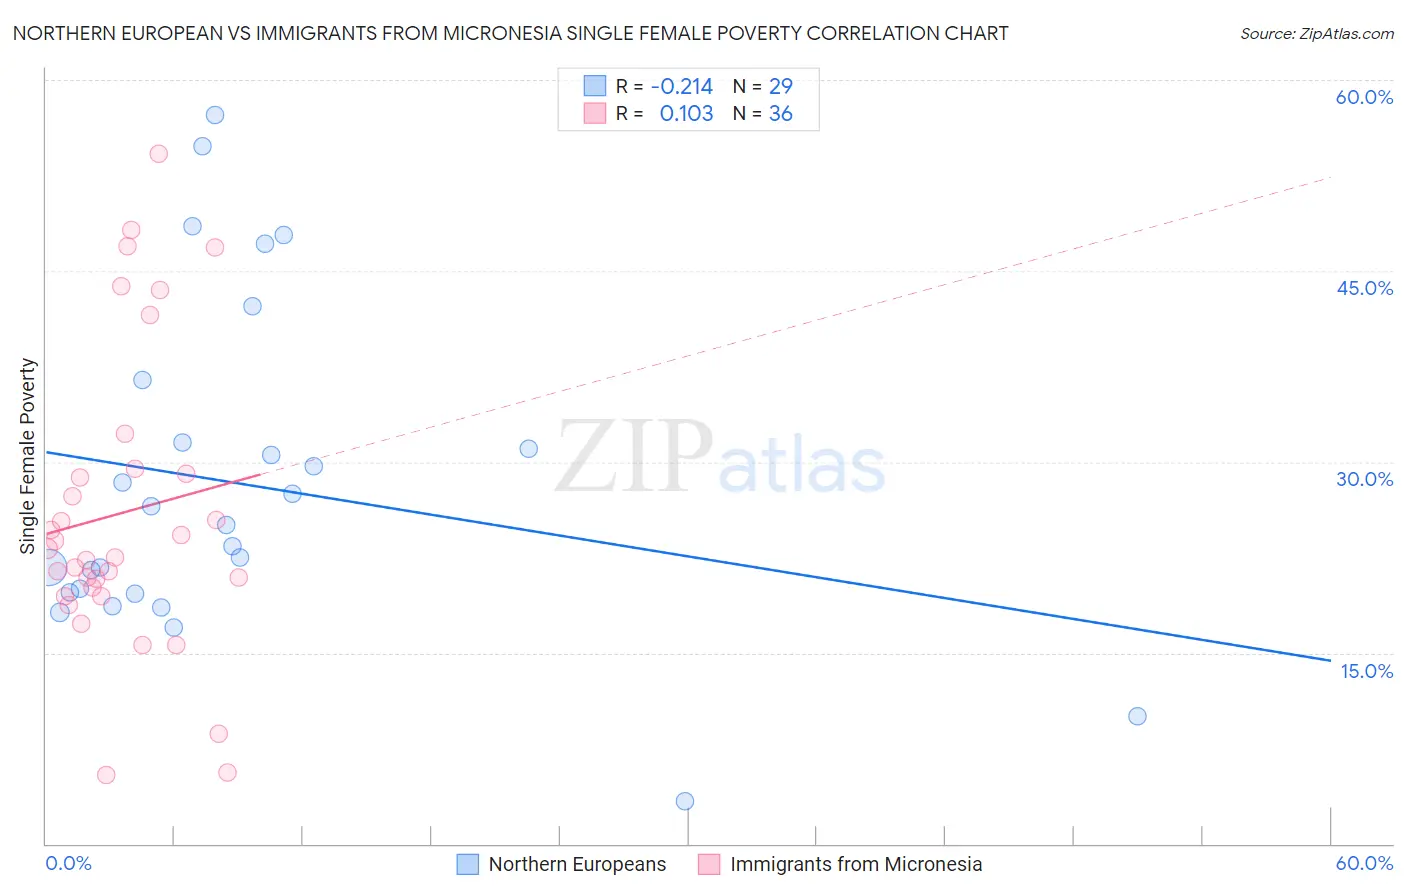
Northern European vs Immigrants from Micronesia Single Female Poverty Correlation Chart
The statistical analysis conducted on geographies consisting of 398,261,787 people shows a weak negative correlation between the proportion of Northern Europeans and poverty level among single females in the United States with a correlation coefficient (R) of -0.214 and weighted average of 20.8%. Similarly, the statistical analysis conducted on geographies consisting of 61,492,731 people shows a poor positive correlation between the proportion of Immigrants from Micronesia and poverty level among single females in the United States with a correlation coefficient (R) of 0.103 and weighted average of 23.0%, a difference of 11.0%.
Single Female Poverty Correlation Summary
| Measurement | Northern European | Immigrants from Micronesia |
| Minimum | 3.3% | 5.4% |
| Maximum | 57.3% | 54.2% |
| Range | 54.0% | 48.7% |
| Mean | 28.3% | 26.0% |
| Median | 25.0% | 22.8% |
| Interquartile 25% (IQ1) | 19.7% | 19.8% |
| Interquartile 75% (IQ3) | 34.0% | 29.2% |
| Interquartile Range (IQR) | 14.3% | 9.4% |
| Standard Deviation (Sample) | 13.0% | 11.8% |
| Standard Deviation (Population) | 12.8% | 11.6% |
Similar Demographics by Single Female Poverty
Demographics Similar to Northern Europeans by Single Female Poverty
In terms of single female poverty, the demographic groups most similar to Northern Europeans are Kenyan (20.8%, a difference of 0.010%), Lebanese (20.8%, a difference of 0.050%), Arab (20.7%, a difference of 0.18%), Costa Rican (20.7%, a difference of 0.26%), and Iraqi (20.8%, a difference of 0.27%).
| Demographics | Rating | Rank | Single Female Poverty |
| Samoans | 76.0 /100 | #155 | Good 20.6% |
| South American Indians | 75.7 /100 | #156 | Good 20.6% |
| Immigrants | Oceania | 74.3 /100 | #157 | Good 20.7% |
| Danes | 73.0 /100 | #158 | Good 20.7% |
| Costa Ricans | 71.8 /100 | #159 | Good 20.7% |
| Arabs | 70.8 /100 | #160 | Good 20.7% |
| Kenyans | 68.5 /100 | #161 | Good 20.8% |
| Northern Europeans | 68.4 /100 | #162 | Good 20.8% |
| Lebanese | 67.6 /100 | #163 | Good 20.8% |
| Iraqis | 64.5 /100 | #164 | Good 20.8% |
| Ugandans | 64.0 /100 | #165 | Good 20.8% |
| Norwegians | 63.0 /100 | #166 | Good 20.8% |
| Immigrants | Norway | 63.0 /100 | #167 | Good 20.8% |
| Immigrants | Costa Rica | 61.5 /100 | #168 | Good 20.9% |
| Immigrants | Trinidad and Tobago | 56.3 /100 | #169 | Average 20.9% |
Demographics Similar to Immigrants from Micronesia by Single Female Poverty
In terms of single female poverty, the demographic groups most similar to Immigrants from Micronesia are Senegalese (23.0%, a difference of 0.060%), Fijian (23.1%, a difference of 0.13%), Hmong (23.1%, a difference of 0.16%), Central American (23.0%, a difference of 0.21%), and Immigrants from Laos (22.9%, a difference of 0.38%).
| Demographics | Rating | Rank | Single Female Poverty |
| Whites/Caucasians | 0.6 /100 | #259 | Tragic 22.7% |
| Celtics | 0.5 /100 | #260 | Tragic 22.7% |
| Immigrants | Cabo Verde | 0.4 /100 | #261 | Tragic 22.8% |
| British West Indians | 0.4 /100 | #262 | Tragic 22.8% |
| Scotch-Irish | 0.3 /100 | #263 | Tragic 22.9% |
| Immigrants | Laos | 0.3 /100 | #264 | Tragic 22.9% |
| Central Americans | 0.2 /100 | #265 | Tragic 23.0% |
| Immigrants | Micronesia | 0.2 /100 | #266 | Tragic 23.0% |
| Senegalese | 0.2 /100 | #267 | Tragic 23.0% |
| Fijians | 0.2 /100 | #268 | Tragic 23.1% |
| Hmong | 0.2 /100 | #269 | Tragic 23.1% |
| Inupiat | 0.2 /100 | #270 | Tragic 23.1% |
| Sub-Saharan Africans | 0.1 /100 | #271 | Tragic 23.2% |
| Immigrants | Senegal | 0.1 /100 | #272 | Tragic 23.2% |
| Alaska Natives | 0.1 /100 | #273 | Tragic 23.3% |