Comanche vs Carpatho Rusyn Child Poverty Under the Age of 5
COMPARE
Comanche
Carpatho Rusyn
Child Poverty Under the Age of 5
Child Poverty Under the Age of 5 Comparison
Comanche
Carpatho Rusyns
21.0%
CHILD POVERTY UNDER THE AGE OF 5
0.0/ 100
METRIC RATING
283rd/ 347
METRIC RANK
17.5%
CHILD POVERTY UNDER THE AGE OF 5
33.6/ 100
METRIC RATING
188th/ 347
METRIC RANK
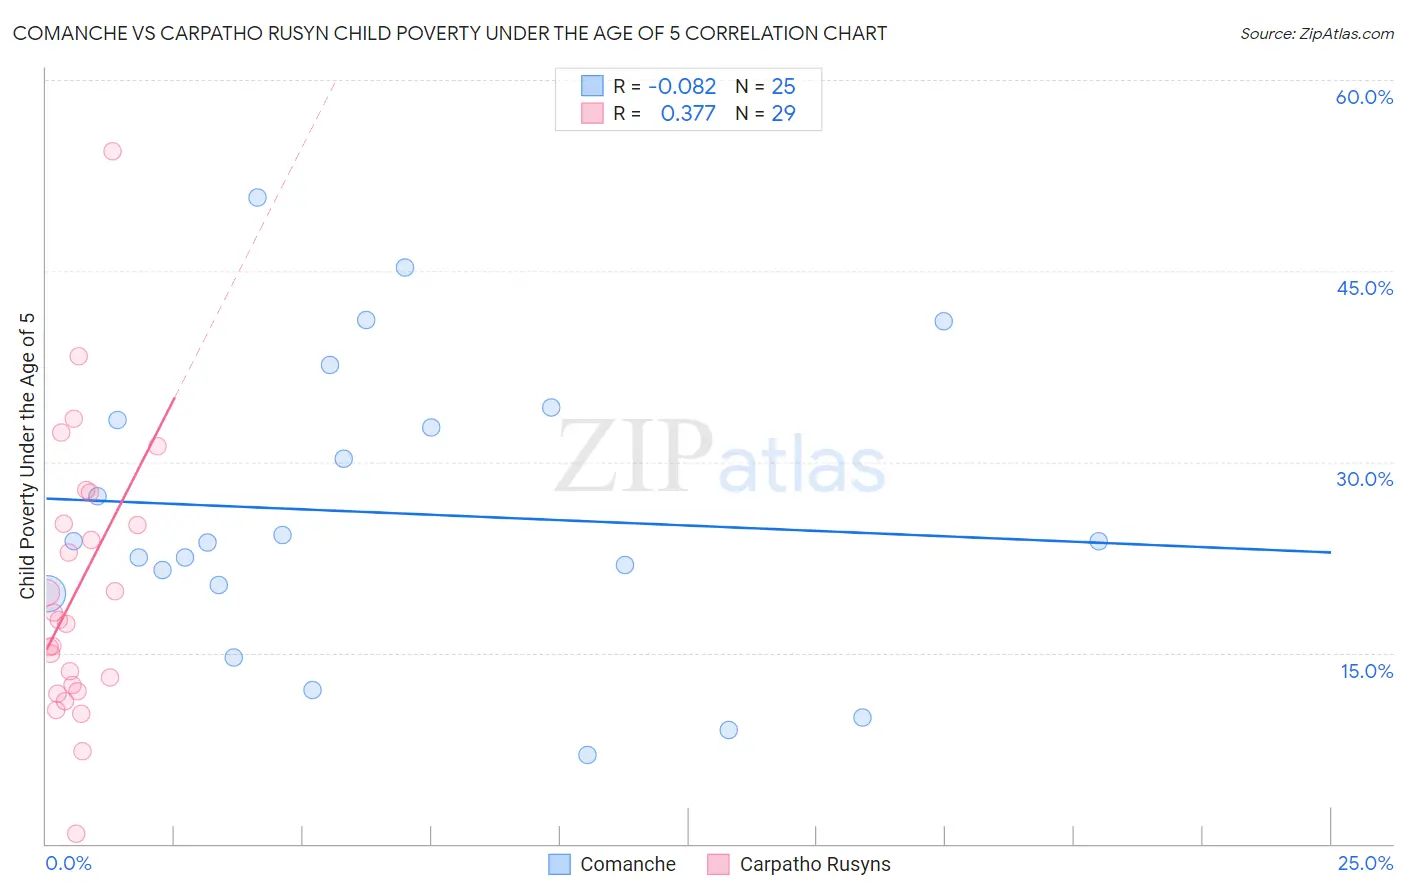
Comanche vs Carpatho Rusyn Child Poverty Under the Age of 5 Correlation Chart
The statistical analysis conducted on geographies consisting of 108,975,573 people shows a slight negative correlation between the proportion of Comanche and poverty level among children under the age of 5 in the United States with a correlation coefficient (R) of -0.082 and weighted average of 21.0%. Similarly, the statistical analysis conducted on geographies consisting of 57,729,795 people shows a mild positive correlation between the proportion of Carpatho Rusyns and poverty level among children under the age of 5 in the United States with a correlation coefficient (R) of 0.377 and weighted average of 17.5%, a difference of 20.0%.
Child Poverty Under the Age of 5 Correlation Summary
| Measurement | Comanche | Carpatho Rusyn |
| Minimum | 6.9% | 0.75% |
| Maximum | 50.7% | 54.4% |
| Range | 43.8% | 53.6% |
| Mean | 26.0% | 20.1% |
| Median | 23.8% | 17.6% |
| Interquartile 25% (IQ1) | 20.0% | 12.2% |
| Interquartile 75% (IQ3) | 33.8% | 26.4% |
| Interquartile Range (IQR) | 13.8% | 14.1% |
| Standard Deviation (Sample) | 11.5% | 10.9% |
| Standard Deviation (Population) | 11.2% | 10.7% |
Similar Demographics by Child Poverty Under the Age of 5
Demographics Similar to Comanche by Child Poverty Under the Age of 5
In terms of child poverty under the age of 5, the demographic groups most similar to Comanche are Potawatomi (21.0%, a difference of 0.20%), Somali (21.1%, a difference of 0.33%), Senegalese (20.9%, a difference of 0.74%), Haitian (21.2%, a difference of 0.80%), and Immigrants from Latin America (21.2%, a difference of 0.88%).
| Demographics | Rating | Rank | Child Poverty Under the Age of 5 |
| West Indians | 0.0 /100 | #276 | Tragic 20.6% |
| Immigrants | West Indies | 0.0 /100 | #277 | Tragic 20.7% |
| Immigrants | Grenada | 0.0 /100 | #278 | Tragic 20.7% |
| Sub-Saharan Africans | 0.0 /100 | #279 | Tragic 20.8% |
| French American Indians | 0.0 /100 | #280 | Tragic 20.8% |
| Senegalese | 0.0 /100 | #281 | Tragic 20.9% |
| Potawatomi | 0.0 /100 | #282 | Tragic 21.0% |
| Comanche | 0.0 /100 | #283 | Tragic 21.0% |
| Somalis | 0.0 /100 | #284 | Tragic 21.1% |
| Haitians | 0.0 /100 | #285 | Tragic 21.2% |
| Immigrants | Latin America | 0.0 /100 | #286 | Tragic 21.2% |
| Immigrants | Zaire | 0.0 /100 | #287 | Tragic 21.3% |
| Immigrants | Senegal | 0.0 /100 | #288 | Tragic 21.3% |
| Immigrants | Haiti | 0.0 /100 | #289 | Tragic 21.3% |
| Immigrants | Caribbean | 0.0 /100 | #290 | Tragic 21.4% |
Demographics Similar to Carpatho Rusyns by Child Poverty Under the Age of 5
In terms of child poverty under the age of 5, the demographic groups most similar to Carpatho Rusyns are French (17.5%, a difference of 0.010%), Kenyan (17.5%, a difference of 0.12%), Immigrants from Bosnia and Herzegovina (17.5%, a difference of 0.16%), Immigrants from Armenia (17.5%, a difference of 0.49%), and Slovak (17.6%, a difference of 0.53%).
| Demographics | Rating | Rank | Child Poverty Under the Age of 5 |
| Immigrants | Germany | 41.0 /100 | #181 | Average 17.4% |
| Arabs | 40.7 /100 | #182 | Average 17.4% |
| Lebanese | 40.3 /100 | #183 | Average 17.4% |
| Immigrants | Costa Rica | 39.0 /100 | #184 | Fair 17.4% |
| Immigrants | Armenia | 38.0 /100 | #185 | Fair 17.5% |
| Immigrants | Bosnia and Herzegovina | 35.0 /100 | #186 | Fair 17.5% |
| Kenyans | 34.7 /100 | #187 | Fair 17.5% |
| Carpatho Rusyns | 33.6 /100 | #188 | Fair 17.5% |
| French | 33.6 /100 | #189 | Fair 17.5% |
| Slovaks | 29.2 /100 | #190 | Fair 17.6% |
| Immigrants | Afghanistan | 27.9 /100 | #191 | Fair 17.7% |
| Immigrants | Uruguay | 27.8 /100 | #192 | Fair 17.7% |
| Immigrants | Uganda | 25.0 /100 | #193 | Fair 17.7% |
| French Canadians | 24.6 /100 | #194 | Fair 17.7% |
| Sierra Leoneans | 24.1 /100 | #195 | Fair 17.7% |