Comanche vs Carpatho Rusyn College, Under 1 year
COMPARE
Comanche
Carpatho Rusyn
College, Under 1 year
College, Under 1 year Comparison
Comanche
Carpatho Rusyns
61.4%
COLLEGE, UNDER 1 YEAR
0.4/ 100
METRIC RATING
255th/ 347
METRIC RANK
67.9%
COLLEGE, UNDER 1 YEAR
96.8/ 100
METRIC RATING
103rd/ 347
METRIC RANK
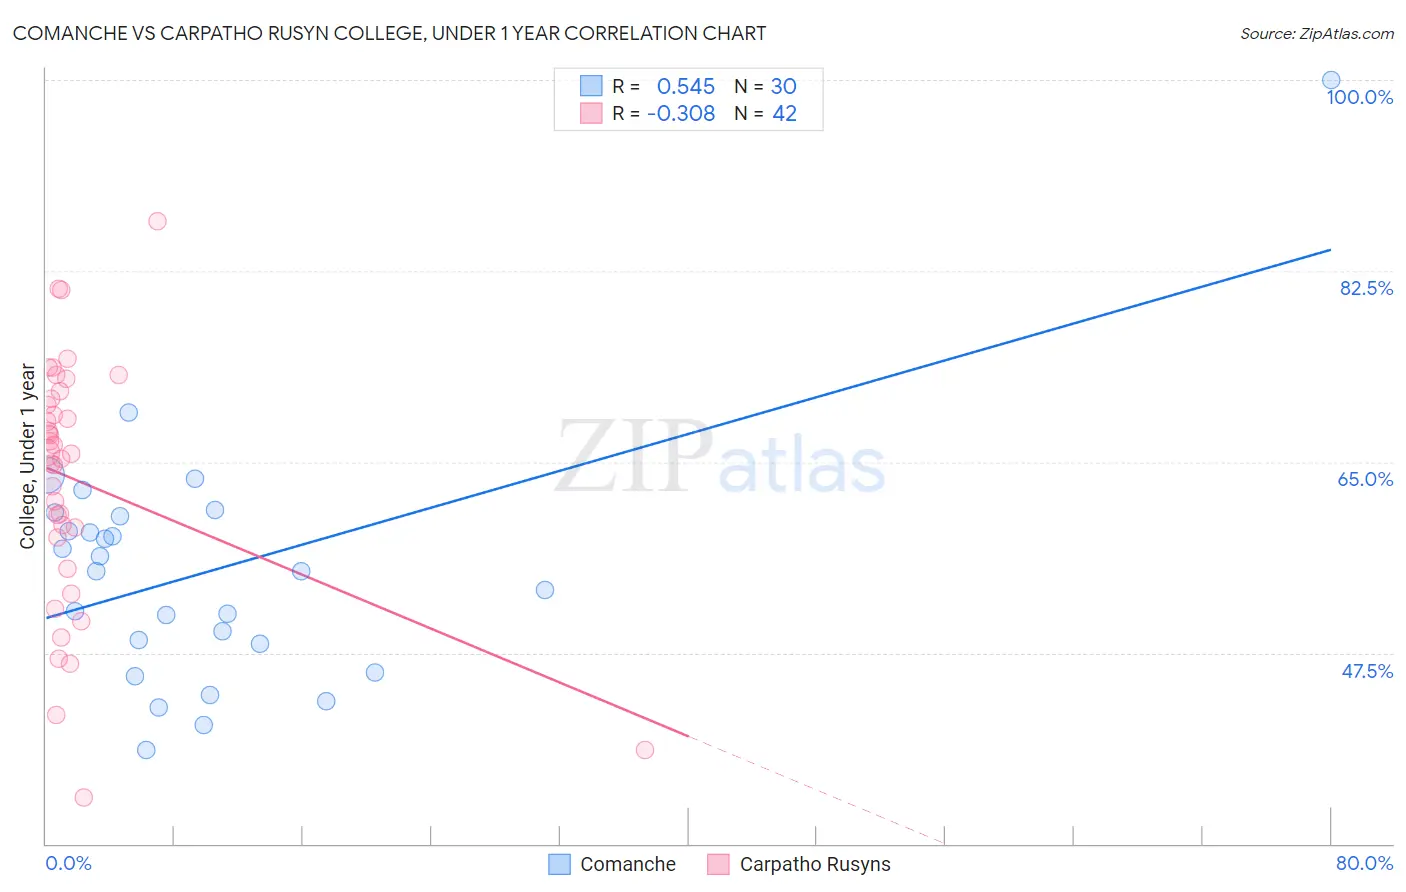
Comanche vs Carpatho Rusyn College, Under 1 year Correlation Chart
The statistical analysis conducted on geographies consisting of 109,786,512 people shows a substantial positive correlation between the proportion of Comanche and percentage of population with at least college, under 1 year education in the United States with a correlation coefficient (R) of 0.545 and weighted average of 61.4%. Similarly, the statistical analysis conducted on geographies consisting of 58,871,690 people shows a mild negative correlation between the proportion of Carpatho Rusyns and percentage of population with at least college, under 1 year education in the United States with a correlation coefficient (R) of -0.308 and weighted average of 67.9%, a difference of 10.6%.
College, Under 1 year Correlation Summary
| Measurement | Comanche | Carpatho Rusyn |
| Minimum | 38.6% | 34.2% |
| Maximum | 100.0% | 87.0% |
| Range | 61.4% | 52.8% |
| Mean | 55.0% | 63.3% |
| Median | 54.9% | 65.8% |
| Interquartile 25% (IQ1) | 48.4% | 58.1% |
| Interquartile 75% (IQ3) | 60.0% | 70.8% |
| Interquartile Range (IQR) | 11.6% | 12.7% |
| Standard Deviation (Sample) | 11.5% | 11.5% |
| Standard Deviation (Population) | 11.3% | 11.3% |
Similar Demographics by College, Under 1 year
Demographics Similar to Comanche by College, Under 1 year
In terms of college, under 1 year, the demographic groups most similar to Comanche are Bangladeshi (61.4%, a difference of 0.040%), Immigrants from Cambodia (61.5%, a difference of 0.12%), West Indian (61.5%, a difference of 0.13%), Japanese (61.5%, a difference of 0.13%), and Immigrants from Laos (61.3%, a difference of 0.16%).
| Demographics | Rating | Rank | College, Under 1 year |
| Potawatomi | 0.6 /100 | #248 | Tragic 61.8% |
| Vietnamese | 0.5 /100 | #249 | Tragic 61.7% |
| Immigrants | Congo | 0.5 /100 | #250 | Tragic 61.7% |
| Immigrants | Micronesia | 0.5 /100 | #251 | Tragic 61.5% |
| West Indians | 0.4 /100 | #252 | Tragic 61.5% |
| Japanese | 0.4 /100 | #253 | Tragic 61.5% |
| Immigrants | Cambodia | 0.4 /100 | #254 | Tragic 61.5% |
| Comanche | 0.4 /100 | #255 | Tragic 61.4% |
| Bangladeshis | 0.4 /100 | #256 | Tragic 61.4% |
| Immigrants | Laos | 0.3 /100 | #257 | Tragic 61.3% |
| Immigrants | Bangladesh | 0.3 /100 | #258 | Tragic 61.3% |
| Indonesians | 0.3 /100 | #259 | Tragic 61.2% |
| Blackfeet | 0.3 /100 | #260 | Tragic 61.1% |
| Africans | 0.3 /100 | #261 | Tragic 61.1% |
| Barbadians | 0.2 /100 | #262 | Tragic 61.1% |
Demographics Similar to Carpatho Rusyns by College, Under 1 year
In terms of college, under 1 year, the demographic groups most similar to Carpatho Rusyns are Immigrants from Eastern Europe (67.9%, a difference of 0.010%), Palestinian (67.9%, a difference of 0.010%), Immigrants from Argentina (67.9%, a difference of 0.060%), Immigrants from Bolivia (67.9%, a difference of 0.070%), and Immigrants from Western Asia (67.8%, a difference of 0.070%).
| Demographics | Rating | Rank | College, Under 1 year |
| Jordanians | 97.4 /100 | #96 | Exceptional 68.0% |
| Immigrants | Ethiopia | 97.3 /100 | #97 | Exceptional 68.0% |
| Paraguayans | 97.1 /100 | #98 | Exceptional 67.9% |
| Immigrants | Bolivia | 97.0 /100 | #99 | Exceptional 67.9% |
| Immigrants | Argentina | 97.0 /100 | #100 | Exceptional 67.9% |
| Immigrants | Eastern Europe | 96.9 /100 | #101 | Exceptional 67.9% |
| Palestinians | 96.9 /100 | #102 | Exceptional 67.9% |
| Carpatho Rusyns | 96.8 /100 | #103 | Exceptional 67.9% |
| Immigrants | Western Asia | 96.6 /100 | #104 | Exceptional 67.8% |
| Afghans | 96.6 /100 | #105 | Exceptional 67.8% |
| Immigrants | Croatia | 96.6 /100 | #106 | Exceptional 67.8% |
| Austrians | 96.4 /100 | #107 | Exceptional 67.8% |
| Immigrants | Egypt | 96.0 /100 | #108 | Exceptional 67.7% |
| Scandinavians | 95.8 /100 | #109 | Exceptional 67.7% |
| Assyrians/Chaldeans/Syriacs | 95.8 /100 | #110 | Exceptional 67.7% |