Lithuanian vs Salvadoran Single Male Poverty
COMPARE
Lithuanian
Salvadoran
Single Male Poverty
Single Male Poverty Comparison
Lithuanians
Salvadorans
13.0%
SINGLE MALE POVERTY
22.1/ 100
METRIC RATING
198th/ 347
METRIC RANK
12.5%
SINGLE MALE POVERTY
83.7/ 100
METRIC RATING
132nd/ 347
METRIC RANK
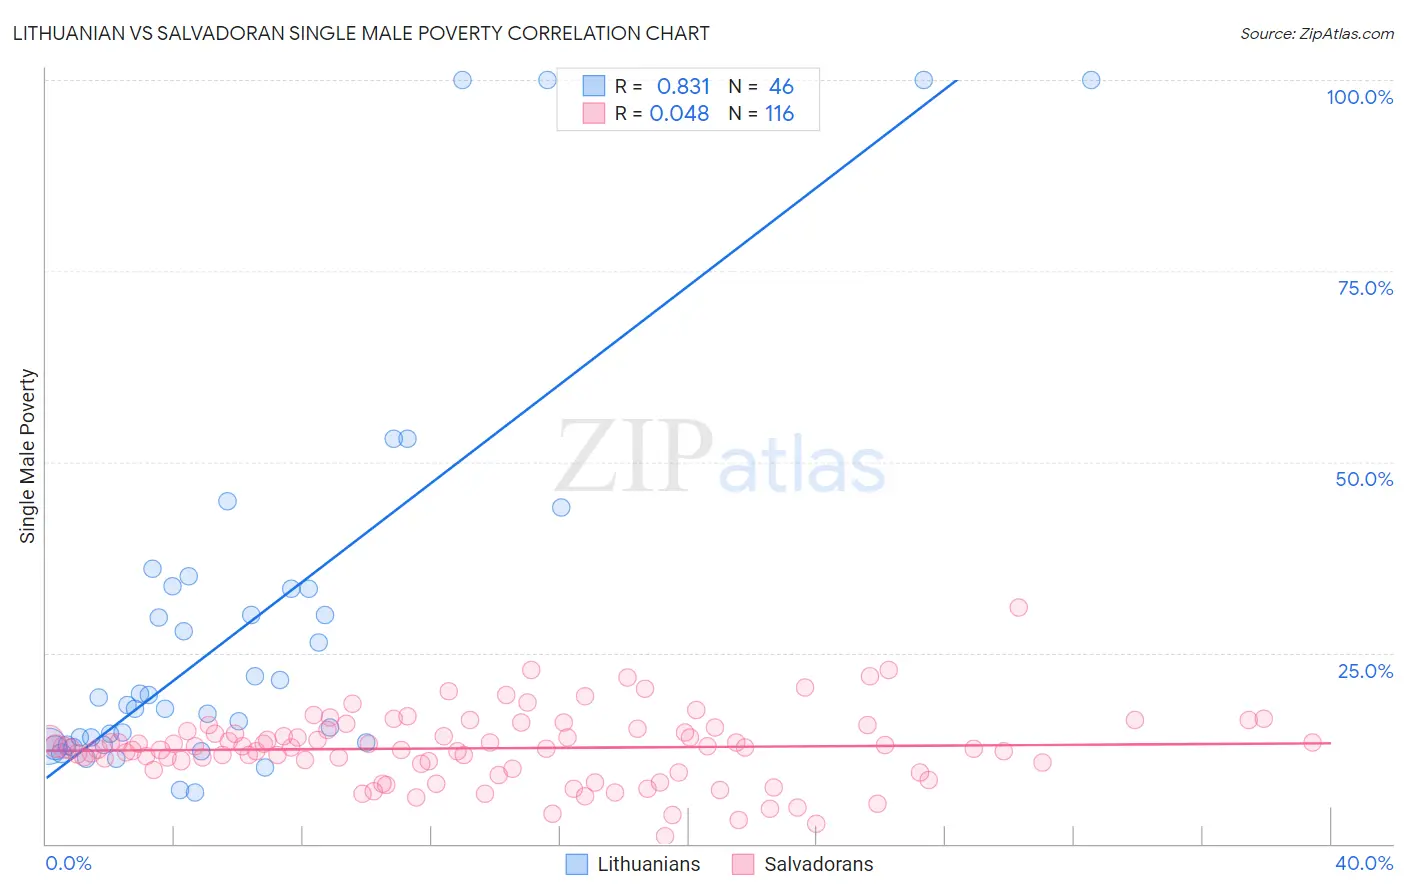
Lithuanian vs Salvadoran Single Male Poverty Correlation Chart
The statistical analysis conducted on geographies consisting of 363,241,212 people shows a very strong positive correlation between the proportion of Lithuanians and poverty level among single males in the United States with a correlation coefficient (R) of 0.831 and weighted average of 13.0%. Similarly, the statistical analysis conducted on geographies consisting of 358,837,331 people shows no correlation between the proportion of Salvadorans and poverty level among single males in the United States with a correlation coefficient (R) of 0.048 and weighted average of 12.5%, a difference of 3.9%.
Single Male Poverty Correlation Summary
| Measurement | Lithuanian | Salvadoran |
| Minimum | 6.7% | 1.0% |
| Maximum | 100.0% | 30.9% |
| Range | 93.3% | 29.9% |
| Mean | 28.6% | 12.5% |
| Median | 18.7% | 12.6% |
| Interquartile 25% (IQ1) | 12.9% | 10.2% |
| Interquartile 75% (IQ3) | 33.3% | 14.9% |
| Interquartile Range (IQR) | 20.5% | 4.7% |
| Standard Deviation (Sample) | 25.0% | 4.7% |
| Standard Deviation (Population) | 24.8% | 4.6% |
Similar Demographics by Single Male Poverty
Demographics Similar to Lithuanians by Single Male Poverty
In terms of single male poverty, the demographic groups most similar to Lithuanians are Immigrants from Norway (13.0%, a difference of 0.020%), Slovene (13.0%, a difference of 0.040%), Trinidadian and Tobagonian (13.0%, a difference of 0.050%), Immigrants from Laos (13.0%, a difference of 0.070%), and Immigrants from Grenada (13.0%, a difference of 0.080%).
| Demographics | Rating | Rank | Single Male Poverty |
| Immigrants | Thailand | 26.6 /100 | #191 | Fair 13.0% |
| Immigrants | Jamaica | 26.5 /100 | #192 | Fair 13.0% |
| Immigrants | South Africa | 26.1 /100 | #193 | Fair 13.0% |
| Liberians | 25.2 /100 | #194 | Fair 13.0% |
| Immigrants | England | 23.4 /100 | #195 | Fair 13.0% |
| Immigrants | Grenada | 23.1 /100 | #196 | Fair 13.0% |
| Immigrants | Laos | 23.1 /100 | #197 | Fair 13.0% |
| Lithuanians | 22.1 /100 | #198 | Fair 13.0% |
| Immigrants | Norway | 21.8 /100 | #199 | Fair 13.0% |
| Slovenes | 21.6 /100 | #200 | Fair 13.0% |
| Trinidadians and Tobagonians | 21.4 /100 | #201 | Fair 13.0% |
| Basques | 20.7 /100 | #202 | Fair 13.0% |
| Immigrants | Bangladesh | 20.4 /100 | #203 | Fair 13.0% |
| Estonians | 20.3 /100 | #204 | Fair 13.0% |
| Poles | 19.3 /100 | #205 | Poor 13.0% |
Demographics Similar to Salvadorans by Single Male Poverty
In terms of single male poverty, the demographic groups most similar to Salvadorans are Immigrants from Northern Europe (12.5%, a difference of 0.0%), Immigrants from Western Asia (12.5%, a difference of 0.030%), Immigrants from Nicaragua (12.5%, a difference of 0.12%), Immigrants from Ecuador (12.5%, a difference of 0.15%), and Immigrants from Costa Rica (12.5%, a difference of 0.17%).
| Demographics | Rating | Rank | Single Male Poverty |
| Immigrants | Jordan | 87.1 /100 | #125 | Excellent 12.5% |
| Romanians | 86.4 /100 | #126 | Excellent 12.5% |
| Immigrants | Netherlands | 86.2 /100 | #127 | Excellent 12.5% |
| Ecuadorians | 85.9 /100 | #128 | Excellent 12.5% |
| Immigrants | Sierra Leone | 85.5 /100 | #129 | Excellent 12.5% |
| Immigrants | Nicaragua | 84.8 /100 | #130 | Excellent 12.5% |
| Immigrants | Northern Europe | 83.7 /100 | #131 | Excellent 12.5% |
| Salvadorans | 83.7 /100 | #132 | Excellent 12.5% |
| Immigrants | Western Asia | 83.4 /100 | #133 | Excellent 12.5% |
| Immigrants | Ecuador | 82.1 /100 | #134 | Excellent 12.5% |
| Immigrants | Costa Rica | 81.9 /100 | #135 | Excellent 12.5% |
| Immigrants | Austria | 81.9 /100 | #136 | Excellent 12.5% |
| Ukrainians | 80.7 /100 | #137 | Excellent 12.6% |
| Immigrants | El Salvador | 80.0 /100 | #138 | Excellent 12.6% |
| Cubans | 79.9 /100 | #139 | Good 12.6% |