Haitian vs Salvadoran Single Male Poverty
COMPARE
Haitian
Salvadoran
Single Male Poverty
Single Male Poverty Comparison
Haitians
Salvadorans
13.2%
SINGLE MALE POVERTY
7.0/ 100
METRIC RATING
227th/ 347
METRIC RANK
12.5%
SINGLE MALE POVERTY
83.7/ 100
METRIC RATING
132nd/ 347
METRIC RANK
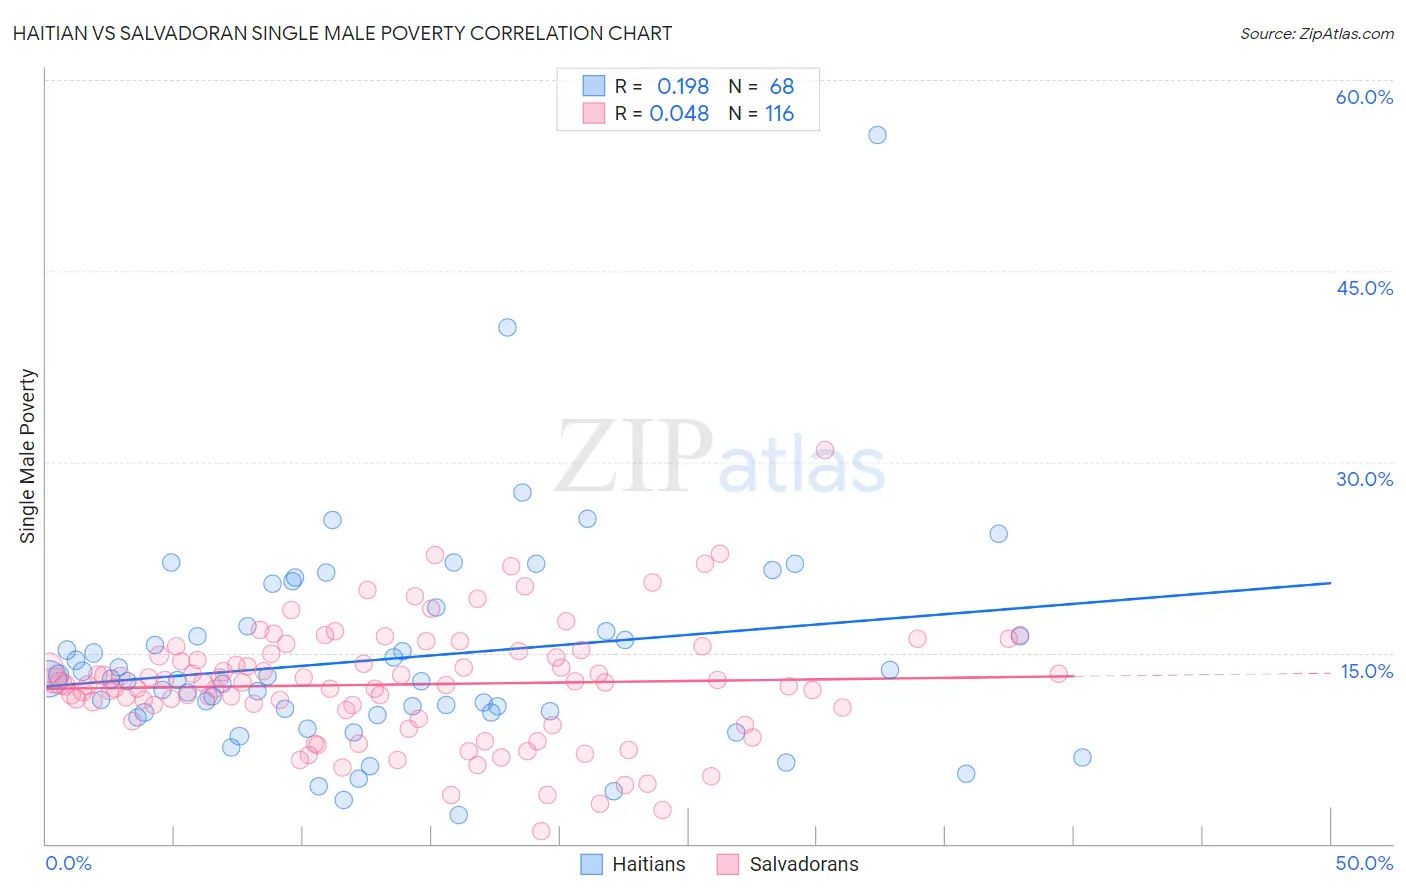
Haitian vs Salvadoran Single Male Poverty Correlation Chart
The statistical analysis conducted on geographies consisting of 262,577,789 people shows a poor positive correlation between the proportion of Haitians and poverty level among single males in the United States with a correlation coefficient (R) of 0.198 and weighted average of 13.2%. Similarly, the statistical analysis conducted on geographies consisting of 358,837,331 people shows no correlation between the proportion of Salvadorans and poverty level among single males in the United States with a correlation coefficient (R) of 0.048 and weighted average of 12.5%, a difference of 5.7%.
Single Male Poverty Correlation Summary
| Measurement | Haitian | Salvadoran |
| Minimum | 2.3% | 1.0% |
| Maximum | 55.7% | 30.9% |
| Range | 53.4% | 29.9% |
| Mean | 14.5% | 12.5% |
| Median | 12.9% | 12.6% |
| Interquartile 25% (IQ1) | 10.3% | 10.2% |
| Interquartile 75% (IQ3) | 16.9% | 14.9% |
| Interquartile Range (IQR) | 6.6% | 4.7% |
| Standard Deviation (Sample) | 8.3% | 4.7% |
| Standard Deviation (Population) | 8.2% | 4.6% |
Similar Demographics by Single Male Poverty
Demographics Similar to Haitians by Single Male Poverty
In terms of single male poverty, the demographic groups most similar to Haitians are Lebanese (13.2%, a difference of 0.080%), Jamaican (13.2%, a difference of 0.13%), European (13.3%, a difference of 0.17%), Ghanaian (13.3%, a difference of 0.20%), and Immigrants from Denmark (13.2%, a difference of 0.30%).
| Demographics | Rating | Rank | Single Male Poverty |
| Central Americans | 10.9 /100 | #220 | Poor 13.2% |
| New Zealanders | 10.7 /100 | #221 | Poor 13.2% |
| Immigrants | Western Europe | 10.0 /100 | #222 | Poor 13.2% |
| Immigrants | Azores | 9.3 /100 | #223 | Tragic 13.2% |
| Somalis | 9.1 /100 | #224 | Tragic 13.2% |
| Immigrants | Denmark | 8.7 /100 | #225 | Tragic 13.2% |
| Jamaicans | 7.7 /100 | #226 | Tragic 13.2% |
| Haitians | 7.0 /100 | #227 | Tragic 13.2% |
| Lebanese | 6.6 /100 | #228 | Tragic 13.2% |
| Europeans | 6.2 /100 | #229 | Tragic 13.3% |
| Ghanaians | 6.1 /100 | #230 | Tragic 13.3% |
| Slavs | 5.3 /100 | #231 | Tragic 13.3% |
| Immigrants | Caribbean | 5.0 /100 | #232 | Tragic 13.3% |
| British | 4.0 /100 | #233 | Tragic 13.3% |
| Canadians | 4.0 /100 | #234 | Tragic 13.3% |
Demographics Similar to Salvadorans by Single Male Poverty
In terms of single male poverty, the demographic groups most similar to Salvadorans are Immigrants from Northern Europe (12.5%, a difference of 0.0%), Immigrants from Western Asia (12.5%, a difference of 0.030%), Immigrants from Nicaragua (12.5%, a difference of 0.12%), Immigrants from Ecuador (12.5%, a difference of 0.15%), and Immigrants from Costa Rica (12.5%, a difference of 0.17%).
| Demographics | Rating | Rank | Single Male Poverty |
| Immigrants | Jordan | 87.1 /100 | #125 | Excellent 12.5% |
| Romanians | 86.4 /100 | #126 | Excellent 12.5% |
| Immigrants | Netherlands | 86.2 /100 | #127 | Excellent 12.5% |
| Ecuadorians | 85.9 /100 | #128 | Excellent 12.5% |
| Immigrants | Sierra Leone | 85.5 /100 | #129 | Excellent 12.5% |
| Immigrants | Nicaragua | 84.8 /100 | #130 | Excellent 12.5% |
| Immigrants | Northern Europe | 83.7 /100 | #131 | Excellent 12.5% |
| Salvadorans | 83.7 /100 | #132 | Excellent 12.5% |
| Immigrants | Western Asia | 83.4 /100 | #133 | Excellent 12.5% |
| Immigrants | Ecuador | 82.1 /100 | #134 | Excellent 12.5% |
| Immigrants | Costa Rica | 81.9 /100 | #135 | Excellent 12.5% |
| Immigrants | Austria | 81.9 /100 | #136 | Excellent 12.5% |
| Ukrainians | 80.7 /100 | #137 | Excellent 12.6% |
| Immigrants | El Salvador | 80.0 /100 | #138 | Excellent 12.6% |
| Cubans | 79.9 /100 | #139 | Good 12.6% |