Immigrants from Europe vs Salvadoran Single Male Poverty
COMPARE
Immigrants from Europe
Salvadoran
Single Male Poverty
Single Male Poverty Comparison
Immigrants from Europe
Salvadorans
12.2%
SINGLE MALE POVERTY
97.0/ 100
METRIC RATING
102nd/ 347
METRIC RANK
12.5%
SINGLE MALE POVERTY
83.7/ 100
METRIC RATING
132nd/ 347
METRIC RANK
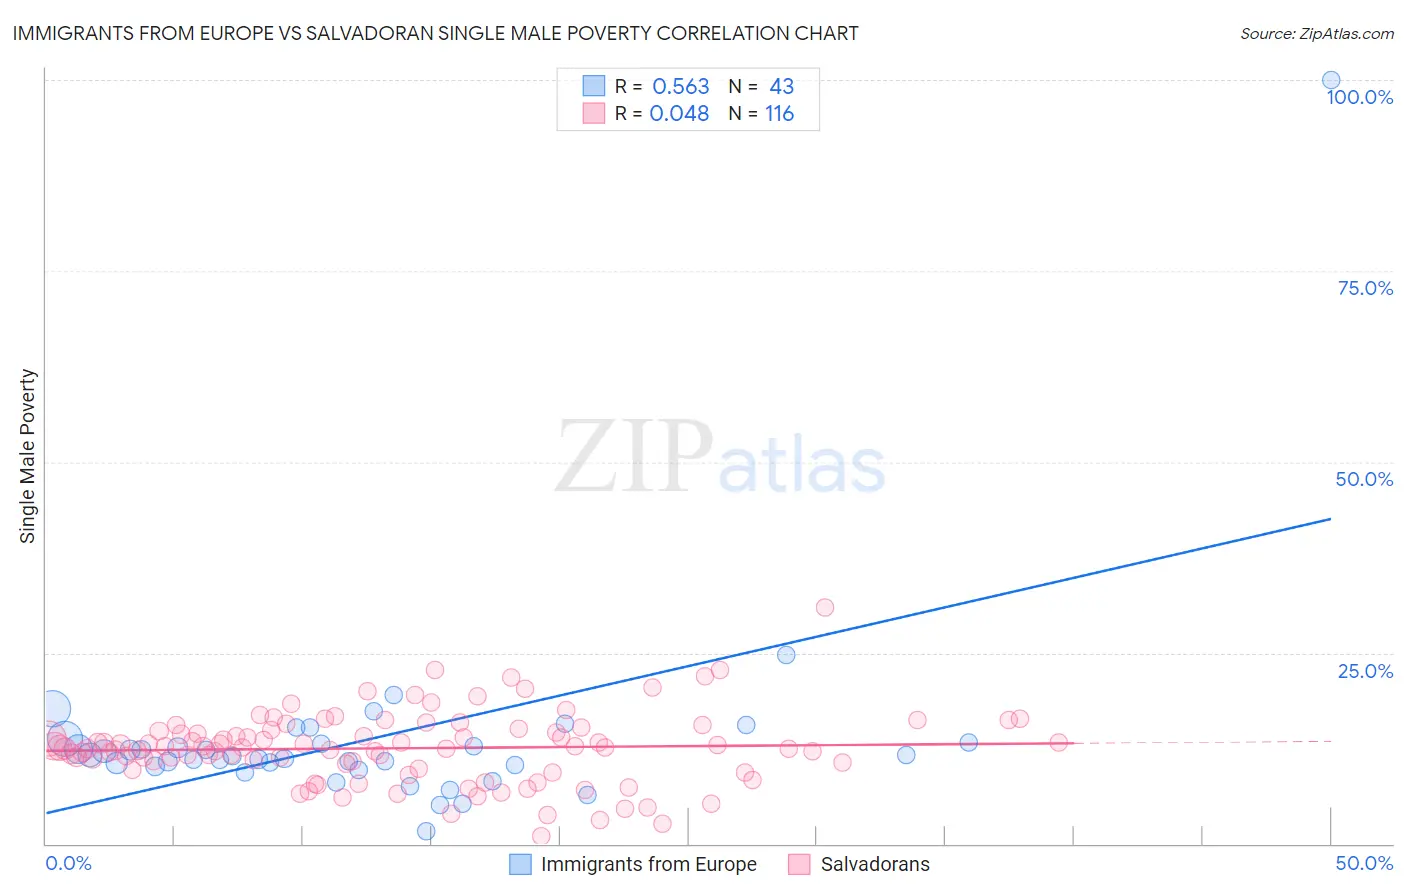
Immigrants from Europe vs Salvadoran Single Male Poverty Correlation Chart
The statistical analysis conducted on geographies consisting of 459,031,824 people shows a substantial positive correlation between the proportion of Immigrants from Europe and poverty level among single males in the United States with a correlation coefficient (R) of 0.563 and weighted average of 12.2%. Similarly, the statistical analysis conducted on geographies consisting of 358,837,331 people shows no correlation between the proportion of Salvadorans and poverty level among single males in the United States with a correlation coefficient (R) of 0.048 and weighted average of 12.5%, a difference of 2.5%.
Single Male Poverty Correlation Summary
| Measurement | Immigrants from Europe | Salvadoran |
| Minimum | 1.6% | 1.0% |
| Maximum | 100.0% | 30.9% |
| Range | 98.4% | 29.9% |
| Mean | 13.7% | 12.5% |
| Median | 11.5% | 12.6% |
| Interquartile 25% (IQ1) | 10.1% | 10.2% |
| Interquartile 75% (IQ3) | 13.3% | 14.9% |
| Interquartile Range (IQR) | 3.2% | 4.7% |
| Standard Deviation (Sample) | 14.1% | 4.7% |
| Standard Deviation (Population) | 13.9% | 4.6% |
Similar Demographics by Single Male Poverty
Demographics Similar to Immigrants from Europe by Single Male Poverty
In terms of single male poverty, the demographic groups most similar to Immigrants from Europe are Immigrants from Latvia (12.2%, a difference of 0.010%), Immigrants from Australia (12.2%, a difference of 0.040%), Immigrants from Armenia (12.2%, a difference of 0.14%), Immigrants from Kazakhstan (12.2%, a difference of 0.14%), and Immigrants from Cuba (12.2%, a difference of 0.16%).
| Demographics | Rating | Rank | Single Male Poverty |
| Mongolians | 97.7 /100 | #95 | Exceptional 12.2% |
| Immigrants | Sweden | 97.5 /100 | #96 | Exceptional 12.2% |
| Immigrants | Italy | 97.4 /100 | #97 | Exceptional 12.2% |
| Guamanians/Chamorros | 97.4 /100 | #98 | Exceptional 12.2% |
| Immigrants | Cuba | 97.3 /100 | #99 | Exceptional 12.2% |
| Immigrants | Australia | 97.1 /100 | #100 | Exceptional 12.2% |
| Immigrants | Latvia | 97.0 /100 | #101 | Exceptional 12.2% |
| Immigrants | Europe | 97.0 /100 | #102 | Exceptional 12.2% |
| Immigrants | Armenia | 96.7 /100 | #103 | Exceptional 12.2% |
| Immigrants | Kazakhstan | 96.7 /100 | #104 | Exceptional 12.2% |
| Jordanians | 95.9 /100 | #105 | Exceptional 12.3% |
| Immigrants | Morocco | 95.6 /100 | #106 | Exceptional 12.3% |
| Iraqis | 95.1 /100 | #107 | Exceptional 12.3% |
| Immigrants | Eastern Africa | 95.0 /100 | #108 | Exceptional 12.3% |
| Ugandans | 94.5 /100 | #109 | Exceptional 12.3% |
Demographics Similar to Salvadorans by Single Male Poverty
In terms of single male poverty, the demographic groups most similar to Salvadorans are Immigrants from Northern Europe (12.5%, a difference of 0.0%), Immigrants from Western Asia (12.5%, a difference of 0.030%), Immigrants from Nicaragua (12.5%, a difference of 0.12%), Immigrants from Ecuador (12.5%, a difference of 0.15%), and Immigrants from Costa Rica (12.5%, a difference of 0.17%).
| Demographics | Rating | Rank | Single Male Poverty |
| Immigrants | Jordan | 87.1 /100 | #125 | Excellent 12.5% |
| Romanians | 86.4 /100 | #126 | Excellent 12.5% |
| Immigrants | Netherlands | 86.2 /100 | #127 | Excellent 12.5% |
| Ecuadorians | 85.9 /100 | #128 | Excellent 12.5% |
| Immigrants | Sierra Leone | 85.5 /100 | #129 | Excellent 12.5% |
| Immigrants | Nicaragua | 84.8 /100 | #130 | Excellent 12.5% |
| Immigrants | Northern Europe | 83.7 /100 | #131 | Excellent 12.5% |
| Salvadorans | 83.7 /100 | #132 | Excellent 12.5% |
| Immigrants | Western Asia | 83.4 /100 | #133 | Excellent 12.5% |
| Immigrants | Ecuador | 82.1 /100 | #134 | Excellent 12.5% |
| Immigrants | Costa Rica | 81.9 /100 | #135 | Excellent 12.5% |
| Immigrants | Austria | 81.9 /100 | #136 | Excellent 12.5% |
| Ukrainians | 80.7 /100 | #137 | Excellent 12.6% |
| Immigrants | El Salvador | 80.0 /100 | #138 | Excellent 12.6% |
| Cubans | 79.9 /100 | #139 | Good 12.6% |