Colville vs Salvadoran Unemployment Among Ages 45 to 54 years
COMPARE
Colville
Salvadoran
Unemployment Among Ages 45 to 54 years
Unemployment Among Ages 45 to 54 years Comparison
Colville
Salvadorans
7.4%
UNEMPLOYMENT AMONG AGES 45 TO 54 YEARS
0.0/ 100
METRIC RATING
338th/ 347
METRIC RANK
4.8%
UNEMPLOYMENT AMONG AGES 45 TO 54 YEARS
0.7/ 100
METRIC RATING
250th/ 347
METRIC RANK
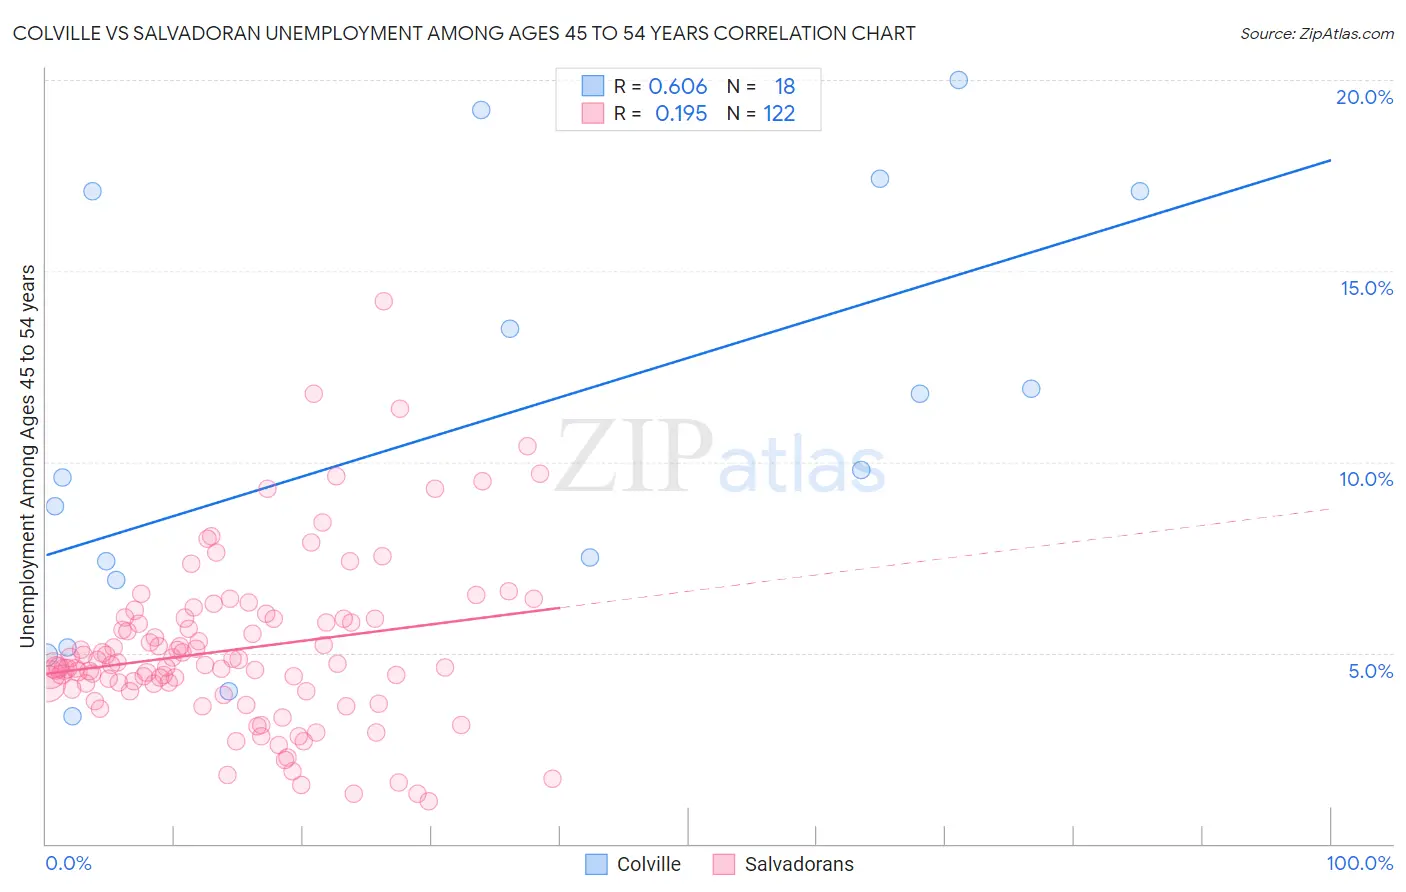
Colville vs Salvadoran Unemployment Among Ages 45 to 54 years Correlation Chart
The statistical analysis conducted on geographies consisting of 34,483,294 people shows a significant positive correlation between the proportion of Colville and unemployment rate among population between the ages 45 and 54 in the United States with a correlation coefficient (R) of 0.606 and weighted average of 7.4%. Similarly, the statistical analysis conducted on geographies consisting of 389,473,672 people shows a poor positive correlation between the proportion of Salvadorans and unemployment rate among population between the ages 45 and 54 in the United States with a correlation coefficient (R) of 0.195 and weighted average of 4.8%, a difference of 54.1%.
Unemployment Among Ages 45 to 54 years Correlation Summary
| Measurement | Colville | Salvadoran |
| Minimum | 3.3% | 1.1% |
| Maximum | 20.0% | 14.2% |
| Range | 16.7% | 13.1% |
| Mean | 10.9% | 5.1% |
| Median | 9.7% | 4.7% |
| Interquartile 25% (IQ1) | 6.9% | 4.1% |
| Interquartile 75% (IQ3) | 17.1% | 5.9% |
| Interquartile Range (IQR) | 10.2% | 1.8% |
| Standard Deviation (Sample) | 5.4% | 2.2% |
| Standard Deviation (Population) | 5.3% | 2.2% |
Similar Demographics by Unemployment Among Ages 45 to 54 years
Demographics Similar to Colville by Unemployment Among Ages 45 to 54 years
In terms of unemployment among ages 45 to 54 years, the demographic groups most similar to Colville are Arapaho (7.5%, a difference of 1.5%), Hopi (7.5%, a difference of 1.9%), Apache (7.0%, a difference of 5.0%), Paiute (7.8%, a difference of 5.5%), and Puerto Rican (6.8%, a difference of 8.5%).
| Demographics | Rating | Rank | Unemployment Among Ages 45 to 54 years |
| Tohono O'odham | 0.0 /100 | #331 | Tragic 6.3% |
| Pima | 0.0 /100 | #332 | Tragic 6.4% |
| Immigrants | Yemen | 0.0 /100 | #333 | Tragic 6.5% |
| Sioux | 0.0 /100 | #334 | Tragic 6.6% |
| Navajo | 0.0 /100 | #335 | Tragic 6.7% |
| Puerto Ricans | 0.0 /100 | #336 | Tragic 6.8% |
| Apache | 0.0 /100 | #337 | Tragic 7.0% |
| Colville | 0.0 /100 | #338 | Tragic 7.4% |
| Arapaho | 0.0 /100 | #339 | Tragic 7.5% |
| Hopi | 0.0 /100 | #340 | Tragic 7.5% |
| Paiute | 0.0 /100 | #341 | Tragic 7.8% |
| Alaskan Athabascans | 0.0 /100 | #342 | Tragic 8.5% |
| Inupiat | 0.0 /100 | #343 | Tragic 9.2% |
| Yuman | 0.0 /100 | #344 | Tragic 9.5% |
| Cheyenne | 0.0 /100 | #345 | Tragic 10.6% |
Demographics Similar to Salvadorans by Unemployment Among Ages 45 to 54 years
In terms of unemployment among ages 45 to 54 years, the demographic groups most similar to Salvadorans are Immigrants from Honduras (4.8%, a difference of 0.070%), Immigrants from Liberia (4.8%, a difference of 0.24%), Israeli (4.8%, a difference of 0.35%), Immigrants from Syria (4.8%, a difference of 0.40%), and Immigrants from Albania (4.8%, a difference of 0.41%).
| Demographics | Rating | Rank | Unemployment Among Ages 45 to 54 years |
| Portuguese | 1.1 /100 | #243 | Tragic 4.8% |
| Seminole | 1.1 /100 | #244 | Tragic 4.8% |
| Immigrants | Albania | 0.9 /100 | #245 | Tragic 4.8% |
| Immigrants | Syria | 0.9 /100 | #246 | Tragic 4.8% |
| Israelis | 0.9 /100 | #247 | Tragic 4.8% |
| Immigrants | Liberia | 0.8 /100 | #248 | Tragic 4.8% |
| Immigrants | Honduras | 0.7 /100 | #249 | Tragic 4.8% |
| Salvadorans | 0.7 /100 | #250 | Tragic 4.8% |
| Hondurans | 0.4 /100 | #251 | Tragic 4.8% |
| Immigrants | Bahamas | 0.3 /100 | #252 | Tragic 4.8% |
| Moroccans | 0.3 /100 | #253 | Tragic 4.8% |
| Immigrants | Lebanon | 0.2 /100 | #254 | Tragic 4.8% |
| Immigrants | El Salvador | 0.2 /100 | #255 | Tragic 4.8% |
| Immigrants | Western Asia | 0.2 /100 | #256 | Tragic 4.8% |
| Immigrants | Western Africa | 0.2 /100 | #257 | Tragic 4.9% |