Colville vs Salvadoran Family Households with Children
COMPARE
Colville
Salvadoran
Family Households with Children
Family Households with Children Comparison
Colville
Salvadorans
26.2%
FAMILY HOUSEHOLDS WITH CHILDREN
0.0/ 100
METRIC RATING
311th/ 347
METRIC RANK
29.9%
FAMILY HOUSEHOLDS WITH CHILDREN
100.0/ 100
METRIC RATING
18th/ 347
METRIC RANK
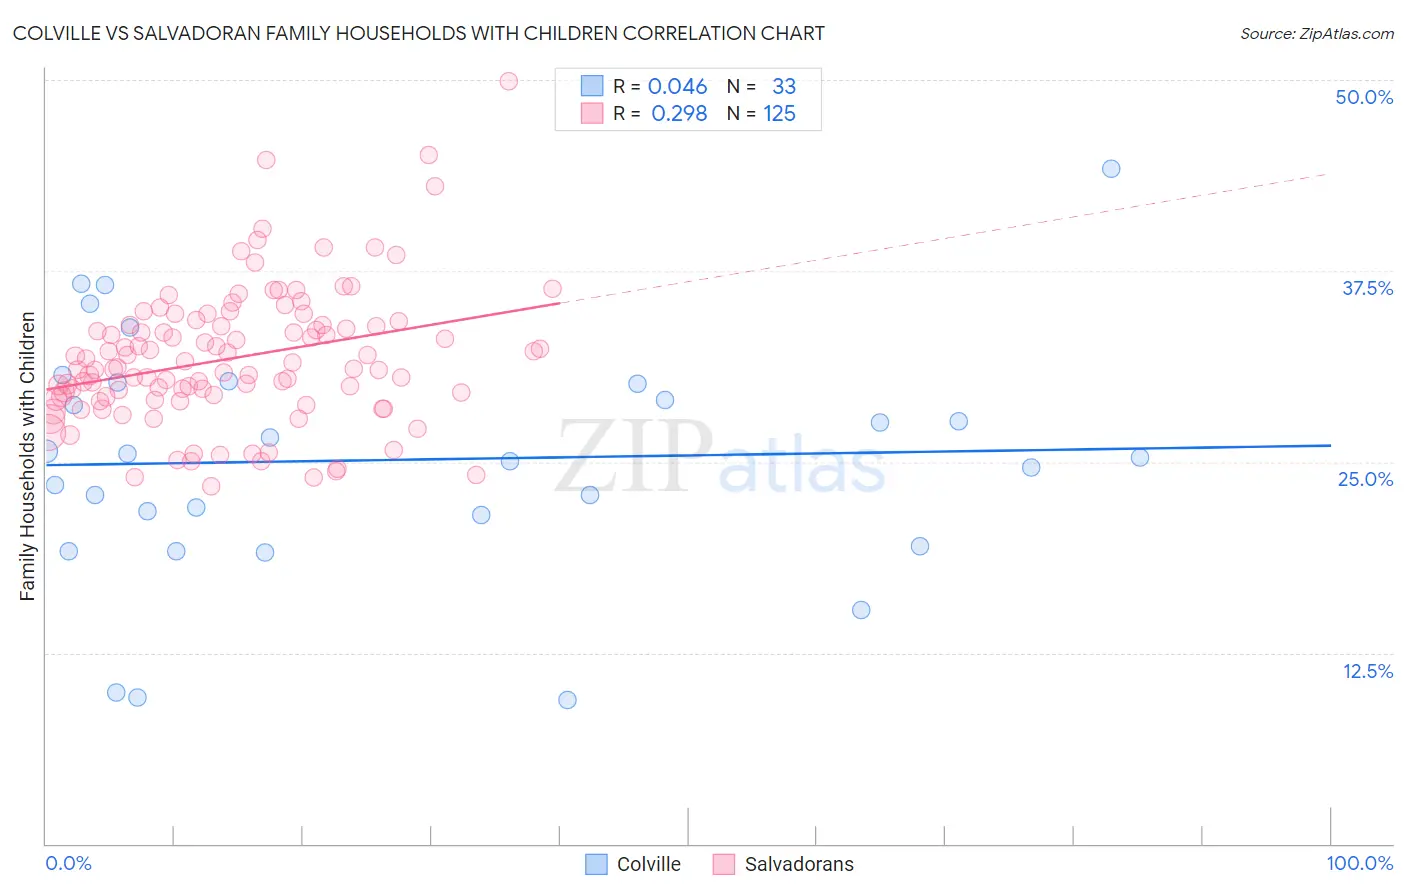
Colville vs Salvadoran Family Households with Children Correlation Chart
The statistical analysis conducted on geographies consisting of 34,682,734 people shows no correlation between the proportion of Colville and percentage of family households with children in the United States with a correlation coefficient (R) of 0.046 and weighted average of 26.2%. Similarly, the statistical analysis conducted on geographies consisting of 398,611,011 people shows a weak positive correlation between the proportion of Salvadorans and percentage of family households with children in the United States with a correlation coefficient (R) of 0.298 and weighted average of 29.9%, a difference of 13.8%.
Family Households with Children Correlation Summary
| Measurement | Colville | Salvadoran |
| Minimum | 9.4% | 23.4% |
| Maximum | 44.2% | 49.9% |
| Range | 34.8% | 26.5% |
| Mean | 25.1% | 31.8% |
| Median | 25.3% | 31.1% |
| Interquartile 25% (IQ1) | 20.5% | 29.2% |
| Interquartile 75% (IQ3) | 30.1% | 34.0% |
| Interquartile Range (IQR) | 9.6% | 4.8% |
| Standard Deviation (Sample) | 7.8% | 4.5% |
| Standard Deviation (Population) | 7.7% | 4.5% |
Similar Demographics by Family Households with Children
Demographics Similar to Colville by Family Households with Children
In terms of family households with children, the demographic groups most similar to Colville are Marshallese (26.2%, a difference of 0.050%), Immigrants from Czechoslovakia (26.2%, a difference of 0.070%), Immigrants from Somalia (26.3%, a difference of 0.090%), Lumbee (26.3%, a difference of 0.20%), and West Indian (26.3%, a difference of 0.22%).
| Demographics | Rating | Rank | Family Households with Children |
| Immigrants | Bahamas | 0.1 /100 | #304 | Tragic 26.3% |
| Guyanese | 0.1 /100 | #305 | Tragic 26.3% |
| Bermudans | 0.1 /100 | #306 | Tragic 26.3% |
| West Indians | 0.0 /100 | #307 | Tragic 26.3% |
| Lumbee | 0.0 /100 | #308 | Tragic 26.3% |
| Immigrants | Somalia | 0.0 /100 | #309 | Tragic 26.3% |
| Marshallese | 0.0 /100 | #310 | Tragic 26.2% |
| Colville | 0.0 /100 | #311 | Tragic 26.2% |
| Immigrants | Czechoslovakia | 0.0 /100 | #312 | Tragic 26.2% |
| Cree | 0.0 /100 | #313 | Tragic 26.2% |
| French Canadians | 0.0 /100 | #314 | Tragic 26.1% |
| Immigrants | Norway | 0.0 /100 | #315 | Tragic 26.1% |
| Estonians | 0.0 /100 | #316 | Tragic 26.1% |
| Ottawa | 0.0 /100 | #317 | Tragic 26.1% |
| Iroquois | 0.0 /100 | #318 | Tragic 26.1% |
Demographics Similar to Salvadorans by Family Households with Children
In terms of family households with children, the demographic groups most similar to Salvadorans are Alaska Native (29.9%, a difference of 0.040%), Immigrants from El Salvador (29.8%, a difference of 0.070%), Immigrants from Laos (29.8%, a difference of 0.11%), Malaysian (29.8%, a difference of 0.14%), and Hispanic or Latino (29.9%, a difference of 0.19%).
| Demographics | Rating | Rank | Family Households with Children |
| Nepalese | 100.0 /100 | #11 | Exceptional 30.5% |
| Immigrants | Pakistan | 100.0 /100 | #12 | Exceptional 30.2% |
| Afghans | 100.0 /100 | #13 | Exceptional 30.2% |
| Bangladeshis | 100.0 /100 | #14 | Exceptional 30.1% |
| Immigrants | South Central Asia | 100.0 /100 | #15 | Exceptional 30.0% |
| Immigrants | Afghanistan | 100.0 /100 | #16 | Exceptional 30.0% |
| Hispanics or Latinos | 100.0 /100 | #17 | Exceptional 29.9% |
| Salvadorans | 100.0 /100 | #18 | Exceptional 29.9% |
| Alaska Natives | 100.0 /100 | #19 | Exceptional 29.9% |
| Immigrants | El Salvador | 100.0 /100 | #20 | Exceptional 29.8% |
| Immigrants | Laos | 100.0 /100 | #21 | Exceptional 29.8% |
| Malaysians | 100.0 /100 | #22 | Exceptional 29.8% |
| Mexican American Indians | 100.0 /100 | #23 | Exceptional 29.7% |
| Guamanians/Chamorros | 100.0 /100 | #24 | Exceptional 29.7% |
| Immigrants | Latin America | 100.0 /100 | #25 | Exceptional 29.7% |