Colville vs Nepalese Single Female Poverty
COMPARE
Colville
Nepalese
Single Female Poverty
Single Female Poverty Comparison
Colville
Nepalese
29.1%
SINGLE FEMALE POVERTY
0.0/ 100
METRIC RATING
336th/ 347
METRIC RANK
21.7%
SINGLE FEMALE POVERTY
9.7/ 100
METRIC RATING
218th/ 347
METRIC RANK
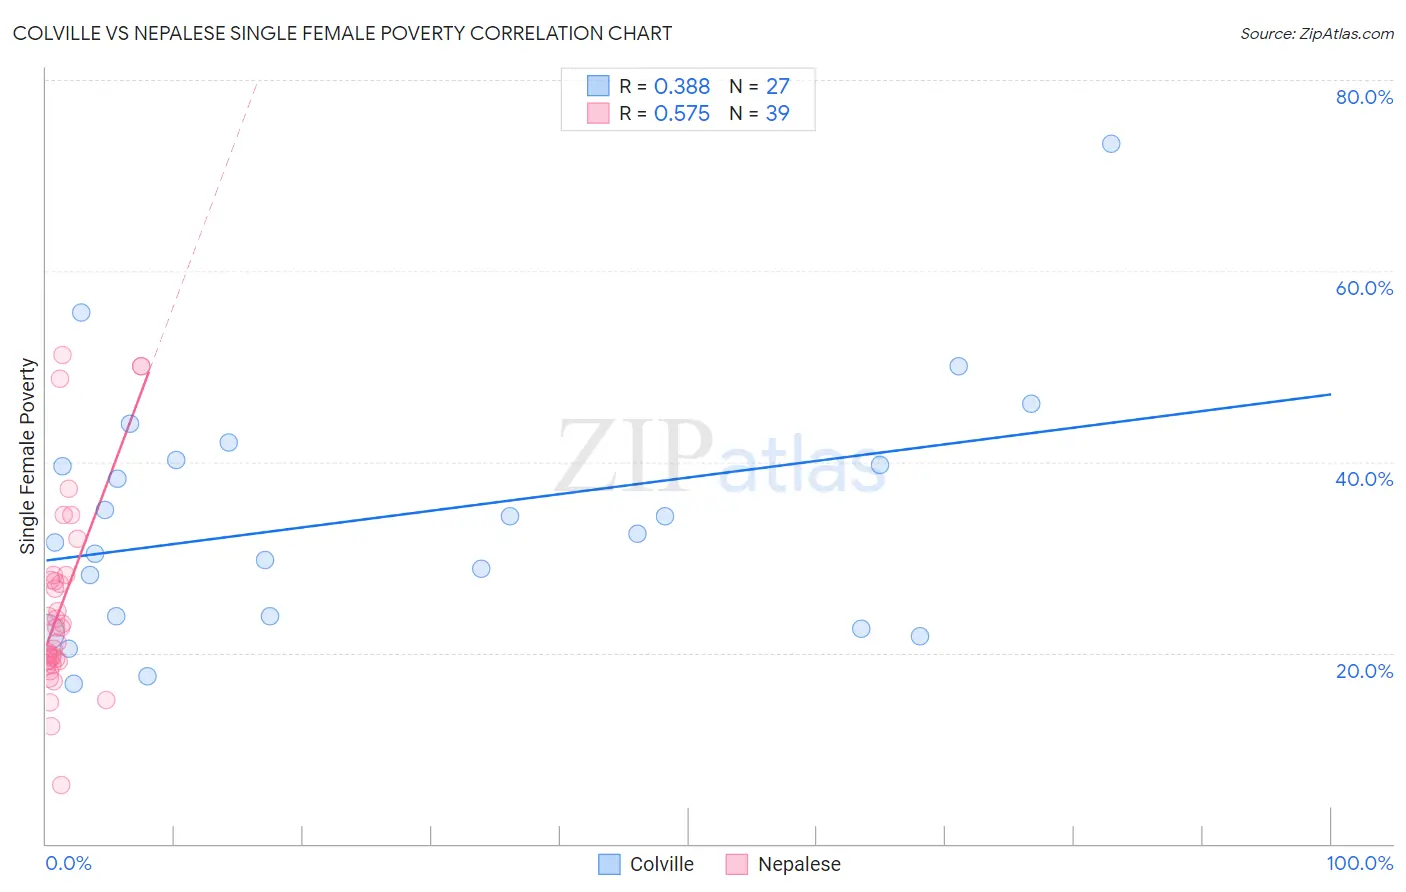
Colville vs Nepalese Single Female Poverty Correlation Chart
The statistical analysis conducted on geographies consisting of 34,604,734 people shows a mild positive correlation between the proportion of Colville and poverty level among single females in the United States with a correlation coefficient (R) of 0.388 and weighted average of 29.1%. Similarly, the statistical analysis conducted on geographies consisting of 24,501,098 people shows a substantial positive correlation between the proportion of Nepalese and poverty level among single females in the United States with a correlation coefficient (R) of 0.575 and weighted average of 21.7%, a difference of 33.8%.
Single Female Poverty Correlation Summary
| Measurement | Colville | Nepalese |
| Minimum | 16.7% | 6.1% |
| Maximum | 73.3% | 51.2% |
| Range | 56.6% | 45.1% |
| Mean | 34.2% | 25.1% |
| Median | 32.4% | 22.6% |
| Interquartile 25% (IQ1) | 23.8% | 19.1% |
| Interquartile 75% (IQ3) | 40.2% | 28.1% |
| Interquartile Range (IQR) | 16.4% | 9.0% |
| Standard Deviation (Sample) | 12.7% | 10.5% |
| Standard Deviation (Population) | 12.4% | 10.4% |
Similar Demographics by Single Female Poverty
Demographics Similar to Colville by Single Female Poverty
In terms of single female poverty, the demographic groups most similar to Colville are Immigrants from Yemen (28.9%, a difference of 0.49%), Yuman (29.4%, a difference of 1.3%), Pueblo (28.6%, a difference of 1.6%), Ute (28.4%, a difference of 2.4%), and Yakama (28.3%, a difference of 2.8%).
| Demographics | Rating | Rank | Single Female Poverty |
| Menominee | 0.0 /100 | #329 | Tragic 27.8% |
| Hopi | 0.0 /100 | #330 | Tragic 28.0% |
| Natives/Alaskans | 0.0 /100 | #331 | Tragic 28.2% |
| Yakama | 0.0 /100 | #332 | Tragic 28.3% |
| Ute | 0.0 /100 | #333 | Tragic 28.4% |
| Pueblo | 0.0 /100 | #334 | Tragic 28.6% |
| Immigrants | Yemen | 0.0 /100 | #335 | Tragic 28.9% |
| Colville | 0.0 /100 | #336 | Tragic 29.1% |
| Yuman | 0.0 /100 | #337 | Tragic 29.4% |
| Pima | 0.0 /100 | #338 | Tragic 30.3% |
| Cheyenne | 0.0 /100 | #339 | Tragic 30.4% |
| Cajuns | 0.0 /100 | #340 | Tragic 30.6% |
| Sioux | 0.0 /100 | #341 | Tragic 31.3% |
| Navajo | 0.0 /100 | #342 | Tragic 31.7% |
| Crow | 0.0 /100 | #343 | Tragic 32.4% |
Demographics Similar to Nepalese by Single Female Poverty
In terms of single female poverty, the demographic groups most similar to Nepalese are Panamanian (21.7%, a difference of 0.050%), German (21.8%, a difference of 0.26%), Immigrants from Grenada (21.8%, a difference of 0.31%), Immigrants from St. Vincent and the Grenadines (21.7%, a difference of 0.32%), and Immigrants from Eritrea (21.8%, a difference of 0.33%).
| Demographics | Rating | Rank | Single Female Poverty |
| Icelanders | 14.0 /100 | #211 | Poor 21.6% |
| Jamaicans | 14.0 /100 | #212 | Poor 21.6% |
| Guamanians/Chamorros | 13.7 /100 | #213 | Poor 21.6% |
| Immigrants | Nicaragua | 13.3 /100 | #214 | Poor 21.6% |
| Ecuadorians | 12.3 /100 | #215 | Poor 21.6% |
| Immigrants | Barbados | 12.2 /100 | #216 | Poor 21.7% |
| Immigrants | St. Vincent and the Grenadines | 11.7 /100 | #217 | Poor 21.7% |
| Nepalese | 9.7 /100 | #218 | Tragic 21.7% |
| Panamanians | 9.4 /100 | #219 | Tragic 21.7% |
| Germans | 8.3 /100 | #220 | Tragic 21.8% |
| Immigrants | Grenada | 8.0 /100 | #221 | Tragic 21.8% |
| Immigrants | Eritrea | 7.9 /100 | #222 | Tragic 21.8% |
| Scottish | 7.3 /100 | #223 | Tragic 21.8% |
| Barbadians | 7.2 /100 | #224 | Tragic 21.8% |
| English | 6.4 /100 | #225 | Tragic 21.9% |