Colville vs Paiute Single Father Poverty
COMPARE
Colville
Paiute
Single Father Poverty
Single Father Poverty Comparison
Colville
Paiute
21.4%
SINGLE FATHER POVERTY
0.0/ 100
METRIC RATING
329th/ 347
METRIC RANK
21.6%
SINGLE FATHER POVERTY
0.0/ 100
METRIC RATING
330th/ 347
METRIC RANK
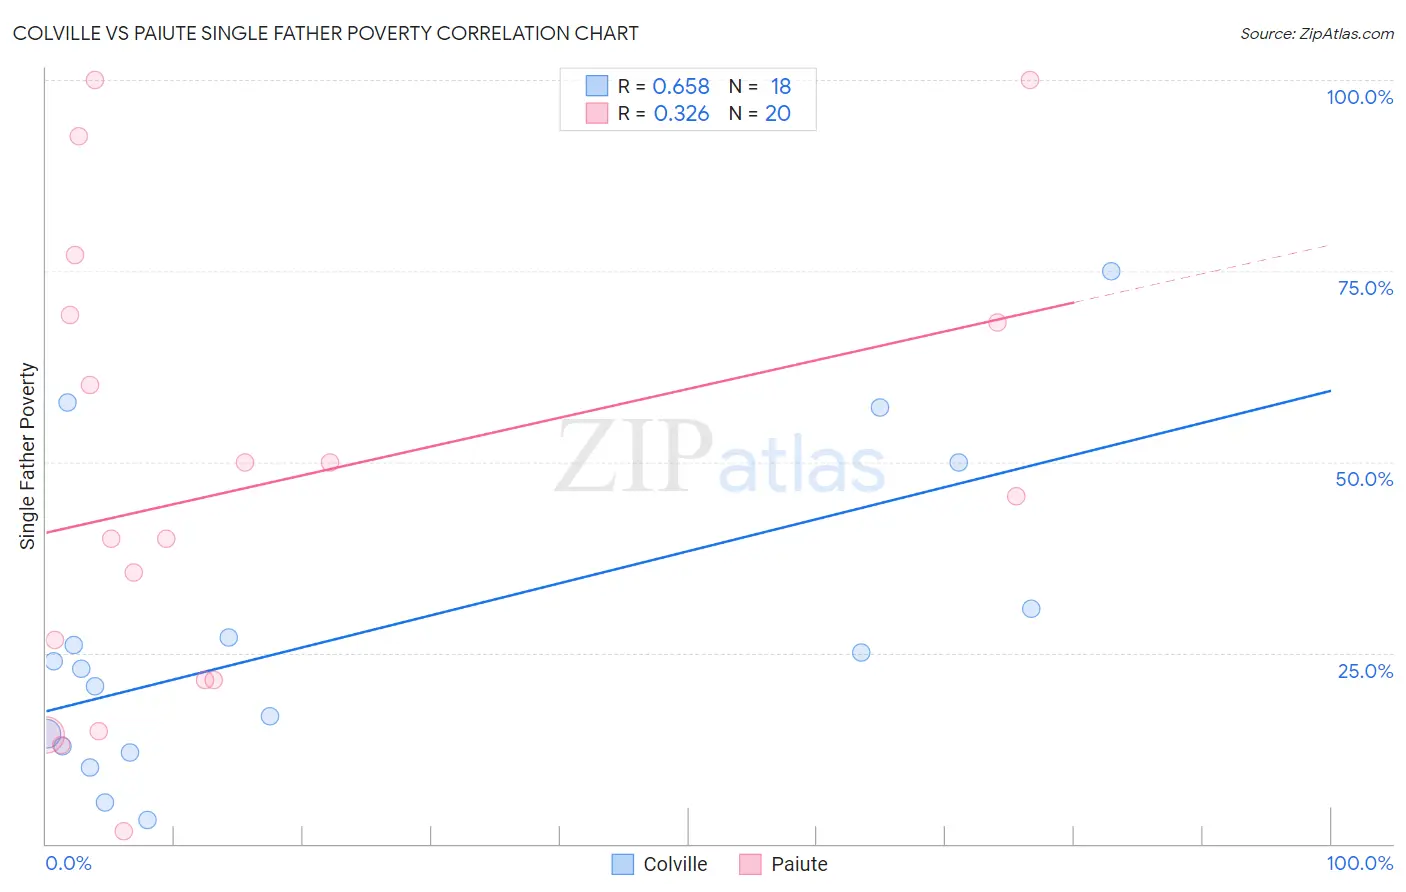
Colville vs Paiute Single Father Poverty Correlation Chart
The statistical analysis conducted on geographies consisting of 32,657,120 people shows a significant positive correlation between the proportion of Colville and poverty level among single fathers in the United States with a correlation coefficient (R) of 0.658 and weighted average of 21.4%. Similarly, the statistical analysis conducted on geographies consisting of 54,887,745 people shows a mild positive correlation between the proportion of Paiute and poverty level among single fathers in the United States with a correlation coefficient (R) of 0.326 and weighted average of 21.6%, a difference of 1.3%.
Single Father Poverty Correlation Summary
| Measurement | Colville | Paiute |
| Minimum | 3.1% | 1.6% |
| Maximum | 75.0% | 100.0% |
| Range | 71.9% | 98.4% |
| Mean | 27.3% | 47.1% |
| Median | 23.4% | 42.7% |
| Interquartile 25% (IQ1) | 12.8% | 21.4% |
| Interquartile 75% (IQ3) | 30.8% | 68.7% |
| Interquartile Range (IQR) | 18.0% | 47.3% |
| Standard Deviation (Sample) | 20.0% | 29.9% |
| Standard Deviation (Population) | 19.4% | 29.2% |
Demographics Similar to Colville and Paiute by Single Father Poverty
In terms of single father poverty, the demographic groups most similar to Colville are Pueblo (21.1%, a difference of 1.1%), Central American Indian (21.7%, a difference of 1.5%), Choctaw (20.7%, a difference of 3.0%), Tohono O'odham (22.0%, a difference of 3.1%), and Immigrants from Yemen (20.6%, a difference of 3.8%). Similarly, the demographic groups most similar to Paiute are Central American Indian (21.7%, a difference of 0.27%), Tohono O'odham (22.0%, a difference of 1.8%), Pueblo (21.1%, a difference of 2.4%), Native/Alaskan (22.4%, a difference of 3.5%), and Kiowa (22.5%, a difference of 3.9%).
| Demographics | Rating | Rank | Single Father Poverty |
| Slovaks | 0.0 /100 | #319 | Tragic 19.3% |
| Inupiat | 0.0 /100 | #320 | Tragic 19.5% |
| Cherokee | 0.0 /100 | #321 | Tragic 19.6% |
| Creek | 0.0 /100 | #322 | Tragic 19.8% |
| Pennsylvania Germans | 0.0 /100 | #323 | Tragic 20.0% |
| Americans | 0.0 /100 | #324 | Tragic 20.1% |
| Blacks/African Americans | 0.0 /100 | #325 | Tragic 20.4% |
| Immigrants | Yemen | 0.0 /100 | #326 | Tragic 20.6% |
| Choctaw | 0.0 /100 | #327 | Tragic 20.7% |
| Pueblo | 0.0 /100 | #328 | Tragic 21.1% |
| Colville | 0.0 /100 | #329 | Tragic 21.4% |
| Paiute | 0.0 /100 | #330 | Tragic 21.6% |
| Central American Indians | 0.0 /100 | #331 | Tragic 21.7% |
| Tohono O'odham | 0.0 /100 | #332 | Tragic 22.0% |
| Natives/Alaskans | 0.0 /100 | #333 | Tragic 22.4% |
| Kiowa | 0.0 /100 | #334 | Tragic 22.5% |
| Shoshone | 0.0 /100 | #335 | Tragic 22.9% |
| Cajuns | 0.0 /100 | #336 | Tragic 23.1% |
| Sioux | 0.0 /100 | #337 | Tragic 23.9% |
| Arapaho | 0.0 /100 | #338 | Tragic 24.0% |
| Apache | 0.0 /100 | #339 | Tragic 24.2% |