Colville vs Croatian Married-Couple Family Poverty
COMPARE
Colville
Croatian
Married-Couple Family Poverty
Married-Couple Family Poverty Comparison
Colville
Croatians
6.3%
MARRIED-COUPLE FAMILY POVERTY
0.1/ 100
METRIC RATING
273rd/ 347
METRIC RANK
3.9%
MARRIED-COUPLE FAMILY POVERTY
100.0/ 100
METRIC RATING
9th/ 347
METRIC RANK
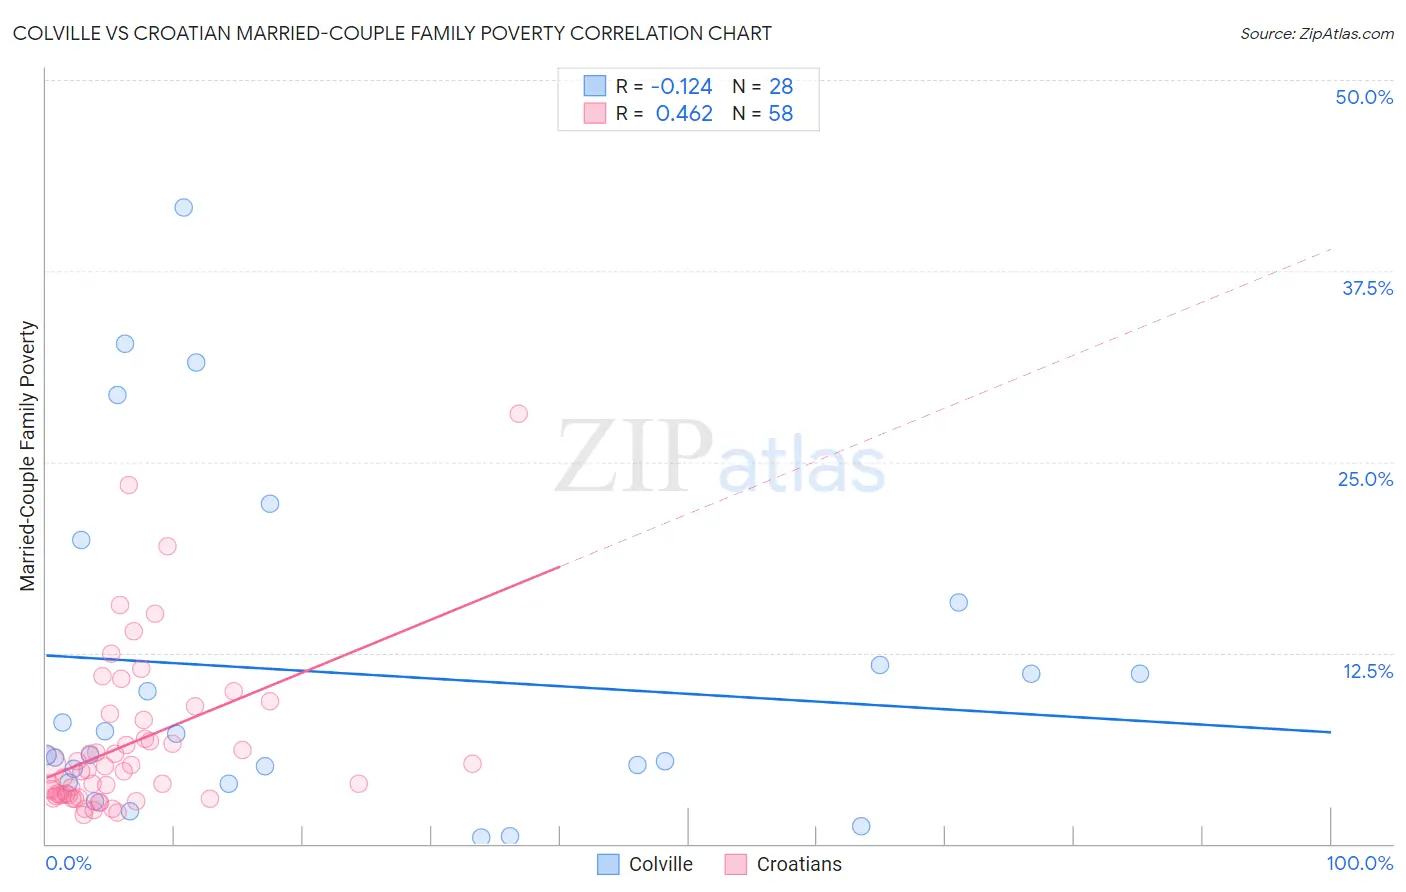
Colville vs Croatian Married-Couple Family Poverty Correlation Chart
The statistical analysis conducted on geographies consisting of 34,633,773 people shows a poor negative correlation between the proportion of Colville and poverty level among married-couple families in the United States with a correlation coefficient (R) of -0.124 and weighted average of 6.3%. Similarly, the statistical analysis conducted on geographies consisting of 371,918,028 people shows a moderate positive correlation between the proportion of Croatians and poverty level among married-couple families in the United States with a correlation coefficient (R) of 0.462 and weighted average of 3.9%, a difference of 59.5%.
Married-Couple Family Poverty Correlation Summary
| Measurement | Colville | Croatian |
| Minimum | 0.42% | 1.8% |
| Maximum | 41.7% | 28.1% |
| Range | 41.2% | 26.3% |
| Mean | 11.2% | 6.6% |
| Median | 6.5% | 4.8% |
| Interquartile 25% (IQ1) | 4.4% | 3.2% |
| Interquartile 75% (IQ3) | 13.7% | 8.1% |
| Interquartile Range (IQR) | 9.3% | 5.0% |
| Standard Deviation (Sample) | 10.9% | 5.3% |
| Standard Deviation (Population) | 10.7% | 5.3% |
Similar Demographics by Married-Couple Family Poverty
Demographics Similar to Colville by Married-Couple Family Poverty
In terms of married-couple family poverty, the demographic groups most similar to Colville are Barbadian (6.3%, a difference of 0.050%), Choctaw (6.3%, a difference of 0.21%), Yaqui (6.3%, a difference of 0.66%), Trinidadian and Tobagonian (6.2%, a difference of 0.78%), and Indonesian (6.3%, a difference of 0.80%).
| Demographics | Rating | Rank | Married-Couple Family Poverty |
| Creek | 0.2 /100 | #266 | Tragic 6.2% |
| Spanish Americans | 0.2 /100 | #267 | Tragic 6.2% |
| Alaska Natives | 0.2 /100 | #268 | Tragic 6.2% |
| Immigrants | West Indies | 0.1 /100 | #269 | Tragic 6.2% |
| Immigrants | Jamaica | 0.1 /100 | #270 | Tragic 6.2% |
| Immigrants | Bahamas | 0.1 /100 | #271 | Tragic 6.2% |
| Trinidadians and Tobagonians | 0.1 /100 | #272 | Tragic 6.2% |
| Colville | 0.1 /100 | #273 | Tragic 6.3% |
| Barbadians | 0.1 /100 | #274 | Tragic 6.3% |
| Choctaw | 0.1 /100 | #275 | Tragic 6.3% |
| Yaqui | 0.1 /100 | #276 | Tragic 6.3% |
| Indonesians | 0.1 /100 | #277 | Tragic 6.3% |
| Immigrants | Trinidad and Tobago | 0.1 /100 | #278 | Tragic 6.4% |
| Houma | 0.0 /100 | #279 | Tragic 6.4% |
| West Indians | 0.0 /100 | #280 | Tragic 6.4% |
Demographics Similar to Croatians by Married-Couple Family Poverty
In terms of married-couple family poverty, the demographic groups most similar to Croatians are Carpatho Rusyn (3.9%, a difference of 0.050%), Thai (3.9%, a difference of 0.44%), Lithuanian (4.0%, a difference of 0.56%), Latvian (3.9%, a difference of 0.98%), and Bulgarian (4.0%, a difference of 1.3%).
| Demographics | Rating | Rank | Married-Couple Family Poverty |
| Chinese | 100.0 /100 | #2 | Exceptional 3.6% |
| Norwegians | 100.0 /100 | #3 | Exceptional 3.7% |
| Slovenes | 100.0 /100 | #4 | Exceptional 3.8% |
| Swedes | 100.0 /100 | #5 | Exceptional 3.9% |
| Luxembourgers | 100.0 /100 | #6 | Exceptional 3.9% |
| Latvians | 100.0 /100 | #7 | Exceptional 3.9% |
| Thais | 100.0 /100 | #8 | Exceptional 3.9% |
| Croatians | 100.0 /100 | #9 | Exceptional 3.9% |
| Carpatho Rusyns | 100.0 /100 | #10 | Exceptional 3.9% |
| Lithuanians | 100.0 /100 | #11 | Exceptional 4.0% |
| Bulgarians | 100.0 /100 | #12 | Exceptional 4.0% |
| Czechs | 100.0 /100 | #13 | Exceptional 4.0% |
| Slovaks | 100.0 /100 | #14 | Exceptional 4.0% |
| Poles | 100.0 /100 | #15 | Exceptional 4.0% |
| Germans | 100.0 /100 | #16 | Exceptional 4.0% |