Colville vs Cambodian Married-Couple Family Poverty
COMPARE
Colville
Cambodian
Married-Couple Family Poverty
Married-Couple Family Poverty Comparison
Colville
Cambodians
6.3%
MARRIED-COUPLE FAMILY POVERTY
0.1/ 100
METRIC RATING
273rd/ 347
METRIC RANK
4.5%
MARRIED-COUPLE FAMILY POVERTY
99.2/ 100
METRIC RATING
75th/ 347
METRIC RANK
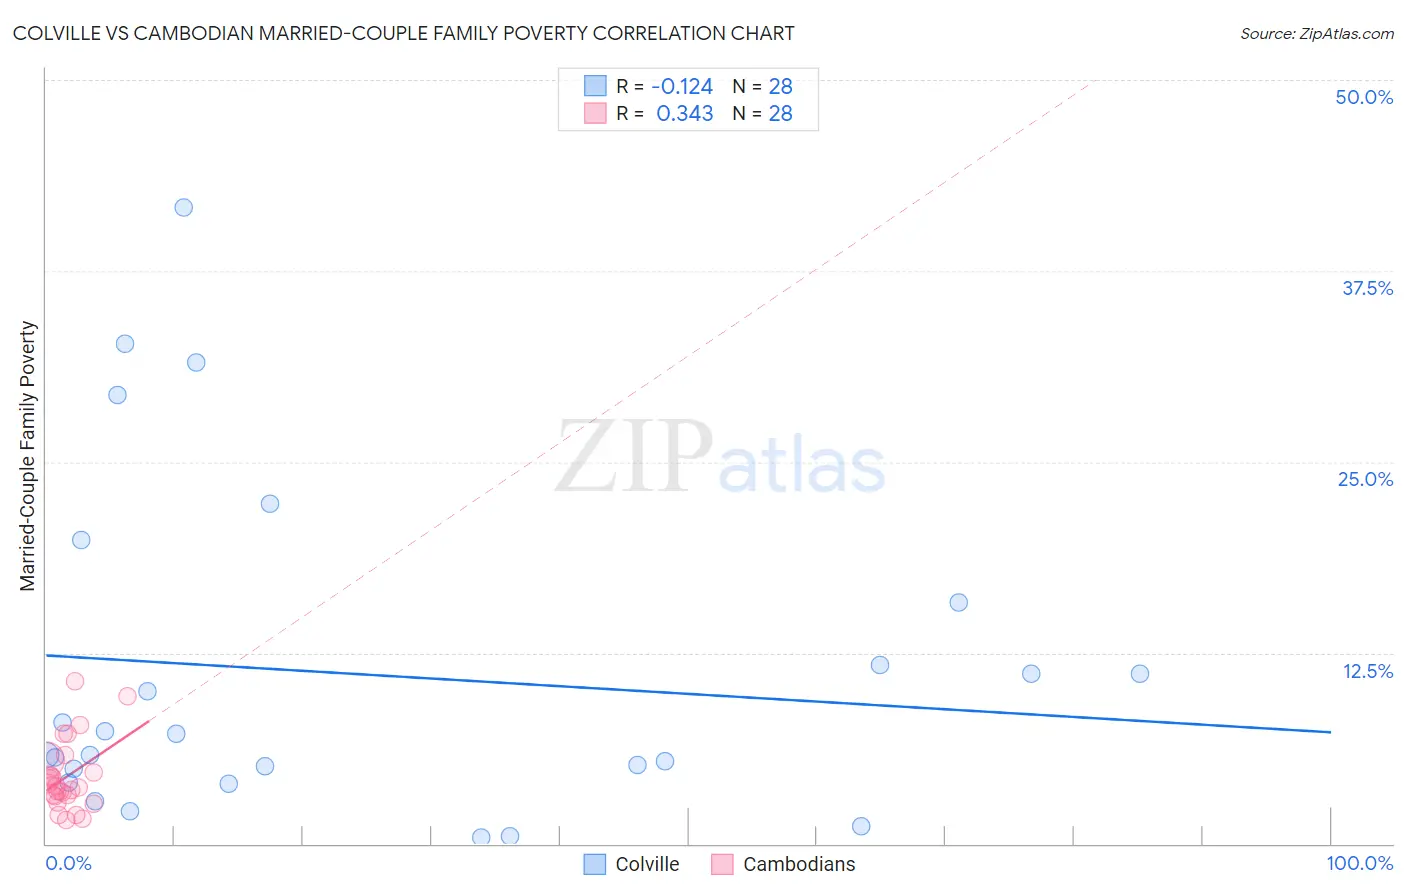
Colville vs Cambodian Married-Couple Family Poverty Correlation Chart
The statistical analysis conducted on geographies consisting of 34,633,773 people shows a poor negative correlation between the proportion of Colville and poverty level among married-couple families in the United States with a correlation coefficient (R) of -0.124 and weighted average of 6.3%. Similarly, the statistical analysis conducted on geographies consisting of 102,246,579 people shows a mild positive correlation between the proportion of Cambodians and poverty level among married-couple families in the United States with a correlation coefficient (R) of 0.343 and weighted average of 4.5%, a difference of 39.7%.
Married-Couple Family Poverty Correlation Summary
| Measurement | Colville | Cambodian |
| Minimum | 0.42% | 1.5% |
| Maximum | 41.7% | 10.6% |
| Range | 41.2% | 9.1% |
| Mean | 11.2% | 4.4% |
| Median | 6.5% | 3.7% |
| Interquartile 25% (IQ1) | 4.4% | 3.2% |
| Interquartile 75% (IQ3) | 13.7% | 5.1% |
| Interquartile Range (IQR) | 9.3% | 1.9% |
| Standard Deviation (Sample) | 10.9% | 2.3% |
| Standard Deviation (Population) | 10.7% | 2.2% |
Similar Demographics by Married-Couple Family Poverty
Demographics Similar to Colville by Married-Couple Family Poverty
In terms of married-couple family poverty, the demographic groups most similar to Colville are Barbadian (6.3%, a difference of 0.050%), Choctaw (6.3%, a difference of 0.21%), Yaqui (6.3%, a difference of 0.66%), Trinidadian and Tobagonian (6.2%, a difference of 0.78%), and Indonesian (6.3%, a difference of 0.80%).
| Demographics | Rating | Rank | Married-Couple Family Poverty |
| Creek | 0.2 /100 | #266 | Tragic 6.2% |
| Spanish Americans | 0.2 /100 | #267 | Tragic 6.2% |
| Alaska Natives | 0.2 /100 | #268 | Tragic 6.2% |
| Immigrants | West Indies | 0.1 /100 | #269 | Tragic 6.2% |
| Immigrants | Jamaica | 0.1 /100 | #270 | Tragic 6.2% |
| Immigrants | Bahamas | 0.1 /100 | #271 | Tragic 6.2% |
| Trinidadians and Tobagonians | 0.1 /100 | #272 | Tragic 6.2% |
| Colville | 0.1 /100 | #273 | Tragic 6.3% |
| Barbadians | 0.1 /100 | #274 | Tragic 6.3% |
| Choctaw | 0.1 /100 | #275 | Tragic 6.3% |
| Yaqui | 0.1 /100 | #276 | Tragic 6.3% |
| Indonesians | 0.1 /100 | #277 | Tragic 6.3% |
| Immigrants | Trinidad and Tobago | 0.1 /100 | #278 | Tragic 6.4% |
| Houma | 0.0 /100 | #279 | Tragic 6.4% |
| West Indians | 0.0 /100 | #280 | Tragic 6.4% |
Demographics Similar to Cambodians by Married-Couple Family Poverty
In terms of married-couple family poverty, the demographic groups most similar to Cambodians are Immigrants from South Africa (4.5%, a difference of 0.11%), Immigrants from Austria (4.5%, a difference of 0.27%), Immigrants from Latvia (4.5%, a difference of 0.28%), Scotch-Irish (4.5%, a difference of 0.36%), and Ukrainian (4.5%, a difference of 0.37%).
| Demographics | Rating | Rank | Married-Couple Family Poverty |
| Slavs | 99.4 /100 | #68 | Exceptional 4.4% |
| New Zealanders | 99.4 /100 | #69 | Exceptional 4.4% |
| Immigrants | Korea | 99.4 /100 | #70 | Exceptional 4.5% |
| Immigrants | North America | 99.3 /100 | #71 | Exceptional 4.5% |
| Immigrants | England | 99.3 /100 | #72 | Exceptional 4.5% |
| Ukrainians | 99.2 /100 | #73 | Exceptional 4.5% |
| Immigrants | Austria | 99.2 /100 | #74 | Exceptional 4.5% |
| Cambodians | 99.2 /100 | #75 | Exceptional 4.5% |
| Immigrants | South Africa | 99.1 /100 | #76 | Exceptional 4.5% |
| Immigrants | Latvia | 99.1 /100 | #77 | Exceptional 4.5% |
| Scotch-Irish | 99.1 /100 | #78 | Exceptional 4.5% |
| Immigrants | Iran | 99.0 /100 | #79 | Exceptional 4.5% |
| Icelanders | 99.0 /100 | #80 | Exceptional 4.5% |
| Immigrants | Greece | 98.9 /100 | #81 | Exceptional 4.5% |
| Canadians | 98.8 /100 | #82 | Exceptional 4.5% |