Chinese vs Immigrants from Sweden Single Female Poverty
COMPARE
Chinese
Immigrants from Sweden
Single Female Poverty
Single Female Poverty Comparison
Chinese
Immigrants from Sweden
16.1%
SINGLE FEMALE POVERTY
100.0/ 100
METRIC RATING
1st/ 347
METRIC RANK
19.4%
SINGLE FEMALE POVERTY
99.2/ 100
METRIC RATING
84th/ 347
METRIC RANK
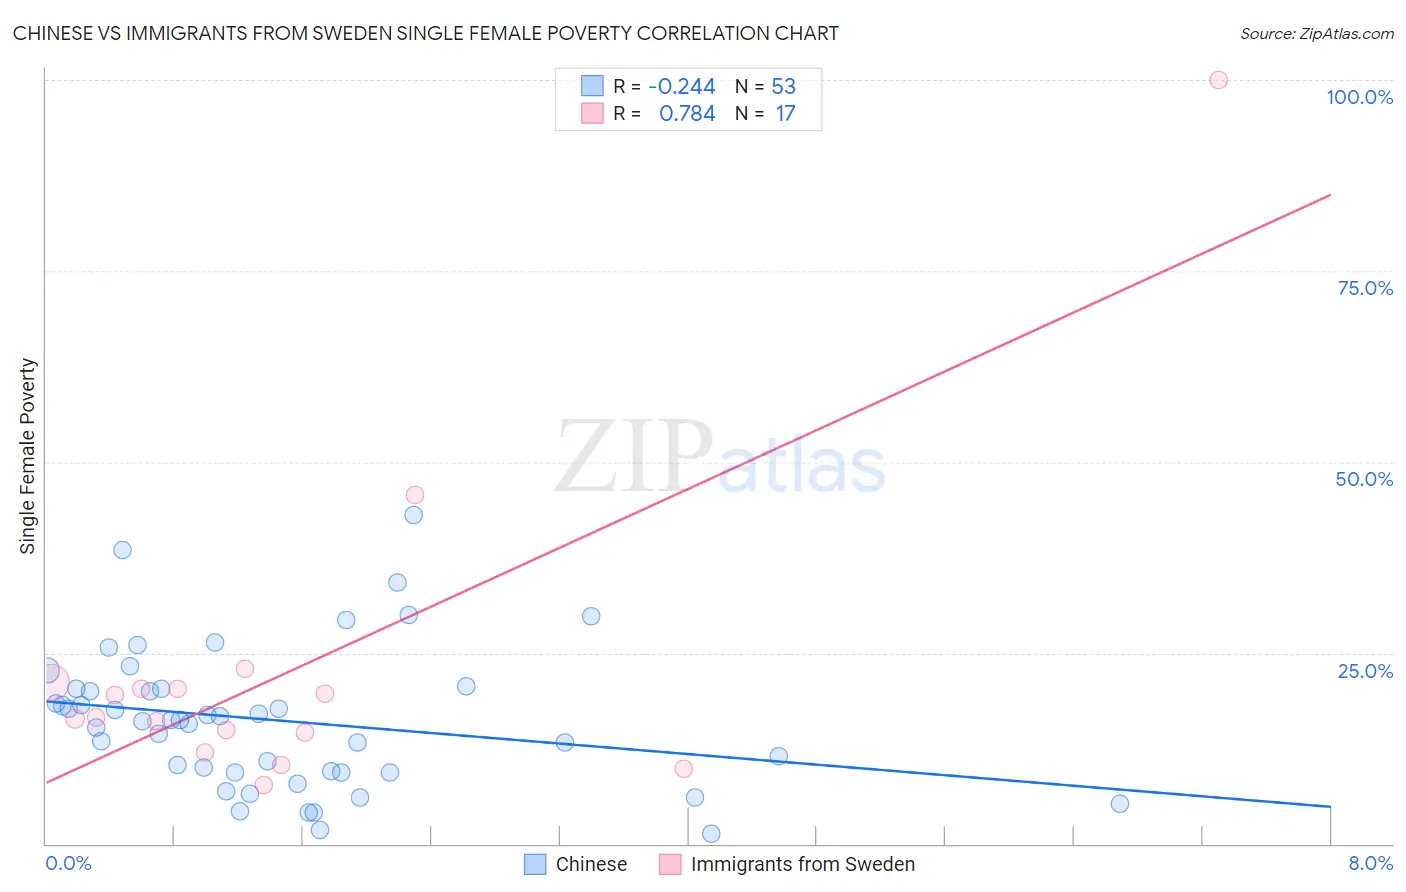
Chinese vs Immigrants from Sweden Single Female Poverty Correlation Chart
The statistical analysis conducted on geographies consisting of 64,651,041 people shows a weak negative correlation between the proportion of Chinese and poverty level among single females in the United States with a correlation coefficient (R) of -0.244 and weighted average of 16.1%. Similarly, the statistical analysis conducted on geographies consisting of 163,142,104 people shows a strong positive correlation between the proportion of Immigrants from Sweden and poverty level among single females in the United States with a correlation coefficient (R) of 0.784 and weighted average of 19.4%, a difference of 20.4%.
Single Female Poverty Correlation Summary
| Measurement | Chinese | Immigrants from Sweden |
| Minimum | 1.3% | 7.8% |
| Maximum | 43.0% | 100.0% |
| Range | 41.7% | 92.2% |
| Mean | 16.1% | 22.8% |
| Median | 16.1% | 16.5% |
| Interquartile 25% (IQ1) | 9.3% | 13.2% |
| Interquartile 75% (IQ3) | 20.3% | 20.7% |
| Interquartile Range (IQR) | 10.9% | 7.5% |
| Standard Deviation (Sample) | 9.1% | 21.6% |
| Standard Deviation (Population) | 9.1% | 20.9% |
Similar Demographics by Single Female Poverty
Demographics Similar to Chinese by Single Female Poverty
In terms of single female poverty, the demographic groups most similar to Chinese are Immigrants from Taiwan (16.4%, a difference of 1.3%), Immigrants from Hong Kong (16.5%, a difference of 2.4%), Immigrants from India (16.8%, a difference of 4.2%), Assyrian/Chaldean/Syriac (17.0%, a difference of 5.0%), and Filipino (17.0%, a difference of 5.2%).
| Demographics | Rating | Rank | Single Female Poverty |
| Chinese | 100.0 /100 | #1 | Exceptional 16.1% |
| Immigrants | Taiwan | 100.0 /100 | #2 | Exceptional 16.4% |
| Immigrants | Hong Kong | 100.0 /100 | #3 | Exceptional 16.5% |
| Immigrants | India | 100.0 /100 | #4 | Exceptional 16.8% |
| Assyrians/Chaldeans/Syriacs | 100.0 /100 | #5 | Exceptional 17.0% |
| Filipinos | 100.0 /100 | #6 | Exceptional 17.0% |
| Thais | 100.0 /100 | #7 | Exceptional 17.3% |
| Immigrants | Iran | 100.0 /100 | #8 | Exceptional 17.5% |
| Bhutanese | 100.0 /100 | #9 | Exceptional 17.7% |
| Immigrants | Ireland | 100.0 /100 | #10 | Exceptional 17.8% |
| Immigrants | Lithuania | 100.0 /100 | #11 | Exceptional 17.8% |
| Immigrants | South Central Asia | 100.0 /100 | #12 | Exceptional 17.8% |
| Immigrants | Bolivia | 100.0 /100 | #13 | Exceptional 17.8% |
| Bolivians | 100.0 /100 | #14 | Exceptional 17.9% |
| Indians (Asian) | 100.0 /100 | #15 | Exceptional 17.9% |
Demographics Similar to Immigrants from Sweden by Single Female Poverty
In terms of single female poverty, the demographic groups most similar to Immigrants from Sweden are Immigrants from Albania (19.4%, a difference of 0.040%), Greek (19.4%, a difference of 0.040%), Taiwanese (19.4%, a difference of 0.080%), Immigrants from Malaysia (19.4%, a difference of 0.090%), and Immigrants from Scotland (19.4%, a difference of 0.10%).
| Demographics | Rating | Rank | Single Female Poverty |
| Immigrants | Russia | 99.3 /100 | #77 | Exceptional 19.4% |
| Albanians | 99.3 /100 | #78 | Exceptional 19.4% |
| Immigrants | Sierra Leone | 99.3 /100 | #79 | Exceptional 19.4% |
| Immigrants | Australia | 99.3 /100 | #80 | Exceptional 19.4% |
| Immigrants | Scotland | 99.2 /100 | #81 | Exceptional 19.4% |
| Immigrants | Malaysia | 99.2 /100 | #82 | Exceptional 19.4% |
| Taiwanese | 99.2 /100 | #83 | Exceptional 19.4% |
| Immigrants | Sweden | 99.2 /100 | #84 | Exceptional 19.4% |
| Immigrants | Albania | 99.2 /100 | #85 | Exceptional 19.4% |
| Greeks | 99.2 /100 | #86 | Exceptional 19.4% |
| Zimbabweans | 99.0 /100 | #87 | Exceptional 19.5% |
| Afghans | 99.0 /100 | #88 | Exceptional 19.5% |
| Immigrants | Ukraine | 99.0 /100 | #89 | Exceptional 19.5% |
| Immigrants | Lebanon | 98.8 /100 | #90 | Exceptional 19.6% |
| Soviet Union | 98.8 /100 | #91 | Exceptional 19.6% |