Chinese vs Immigrants from Afghanistan Single Female Poverty
COMPARE
Chinese
Immigrants from Afghanistan
Single Female Poverty
Single Female Poverty Comparison
Chinese
Immigrants from Afghanistan
16.1%
SINGLE FEMALE POVERTY
100.0/ 100
METRIC RATING
1st/ 347
METRIC RANK
20.0%
SINGLE FEMALE POVERTY
95.4/ 100
METRIC RATING
118th/ 347
METRIC RANK
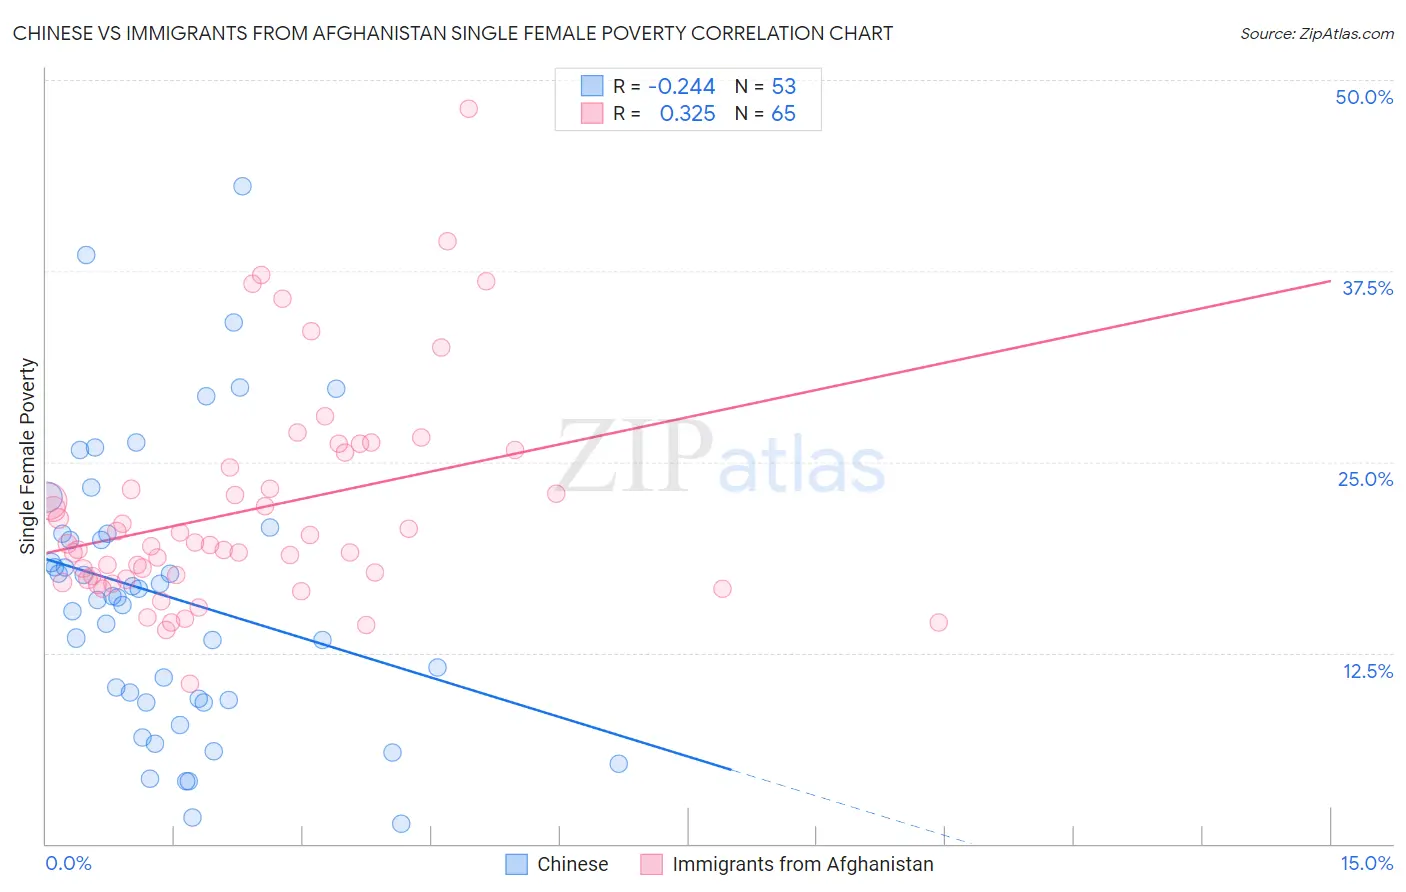
Chinese vs Immigrants from Afghanistan Single Female Poverty Correlation Chart
The statistical analysis conducted on geographies consisting of 64,651,041 people shows a weak negative correlation between the proportion of Chinese and poverty level among single females in the United States with a correlation coefficient (R) of -0.244 and weighted average of 16.1%. Similarly, the statistical analysis conducted on geographies consisting of 146,836,819 people shows a mild positive correlation between the proportion of Immigrants from Afghanistan and poverty level among single females in the United States with a correlation coefficient (R) of 0.325 and weighted average of 20.0%, a difference of 24.0%.
Single Female Poverty Correlation Summary
| Measurement | Chinese | Immigrants from Afghanistan |
| Minimum | 1.3% | 10.5% |
| Maximum | 43.0% | 48.1% |
| Range | 41.7% | 37.7% |
| Mean | 16.1% | 21.8% |
| Median | 16.1% | 19.5% |
| Interquartile 25% (IQ1) | 9.3% | 17.3% |
| Interquartile 75% (IQ3) | 20.3% | 25.1% |
| Interquartile Range (IQR) | 10.9% | 7.8% |
| Standard Deviation (Sample) | 9.1% | 7.1% |
| Standard Deviation (Population) | 9.1% | 7.0% |
Similar Demographics by Single Female Poverty
Demographics Similar to Chinese by Single Female Poverty
In terms of single female poverty, the demographic groups most similar to Chinese are Immigrants from Taiwan (16.4%, a difference of 1.3%), Immigrants from Hong Kong (16.5%, a difference of 2.4%), Immigrants from India (16.8%, a difference of 4.2%), Assyrian/Chaldean/Syriac (17.0%, a difference of 5.0%), and Filipino (17.0%, a difference of 5.2%).
| Demographics | Rating | Rank | Single Female Poverty |
| Chinese | 100.0 /100 | #1 | Exceptional 16.1% |
| Immigrants | Taiwan | 100.0 /100 | #2 | Exceptional 16.4% |
| Immigrants | Hong Kong | 100.0 /100 | #3 | Exceptional 16.5% |
| Immigrants | India | 100.0 /100 | #4 | Exceptional 16.8% |
| Assyrians/Chaldeans/Syriacs | 100.0 /100 | #5 | Exceptional 17.0% |
| Filipinos | 100.0 /100 | #6 | Exceptional 17.0% |
| Thais | 100.0 /100 | #7 | Exceptional 17.3% |
| Immigrants | Iran | 100.0 /100 | #8 | Exceptional 17.5% |
| Bhutanese | 100.0 /100 | #9 | Exceptional 17.7% |
| Immigrants | Ireland | 100.0 /100 | #10 | Exceptional 17.8% |
| Immigrants | Lithuania | 100.0 /100 | #11 | Exceptional 17.8% |
| Immigrants | South Central Asia | 100.0 /100 | #12 | Exceptional 17.8% |
| Immigrants | Bolivia | 100.0 /100 | #13 | Exceptional 17.8% |
| Bolivians | 100.0 /100 | #14 | Exceptional 17.9% |
| Indians (Asian) | 100.0 /100 | #15 | Exceptional 17.9% |
Demographics Similar to Immigrants from Afghanistan by Single Female Poverty
In terms of single female poverty, the demographic groups most similar to Immigrants from Afghanistan are Immigrants from Ethiopia (20.0%, a difference of 0.0%), Polish (20.0%, a difference of 0.080%), South American (20.0%, a difference of 0.10%), Immigrants from Kazakhstan (20.0%, a difference of 0.12%), and Immigrants from Switzerland (20.0%, a difference of 0.13%).
| Demographics | Rating | Rank | Single Female Poverty |
| Carpatho Rusyns | 96.1 /100 | #111 | Exceptional 20.0% |
| Immigrants | Netherlands | 96.0 /100 | #112 | Exceptional 20.0% |
| Immigrants | Zimbabwe | 95.9 /100 | #113 | Exceptional 20.0% |
| Immigrants | Colombia | 95.9 /100 | #114 | Exceptional 20.0% |
| Immigrants | Northern Africa | 95.8 /100 | #115 | Exceptional 20.0% |
| Immigrants | Kazakhstan | 95.7 /100 | #116 | Exceptional 20.0% |
| Poles | 95.6 /100 | #117 | Exceptional 20.0% |
| Immigrants | Afghanistan | 95.4 /100 | #118 | Exceptional 20.0% |
| Immigrants | Ethiopia | 95.4 /100 | #119 | Exceptional 20.0% |
| South Americans | 95.1 /100 | #120 | Exceptional 20.0% |
| Immigrants | Switzerland | 95.1 /100 | #121 | Exceptional 20.0% |
| Immigrants | South America | 95.0 /100 | #122 | Exceptional 20.0% |
| Brazilians | 94.4 /100 | #123 | Exceptional 20.1% |
| Immigrants | Chile | 94.3 /100 | #124 | Exceptional 20.1% |
| Immigrants | South Africa | 93.9 /100 | #125 | Exceptional 20.1% |