Celtic vs Basque Family Poverty
COMPARE
Celtic
Basque
Family Poverty
Family Poverty Comparison
Celtics
Basques
8.8%
FAMILY POVERTY
64.9/ 100
METRIC RATING
164th/ 347
METRIC RANK
8.1%
FAMILY POVERTY
94.9/ 100
METRIC RATING
108th/ 347
METRIC RANK
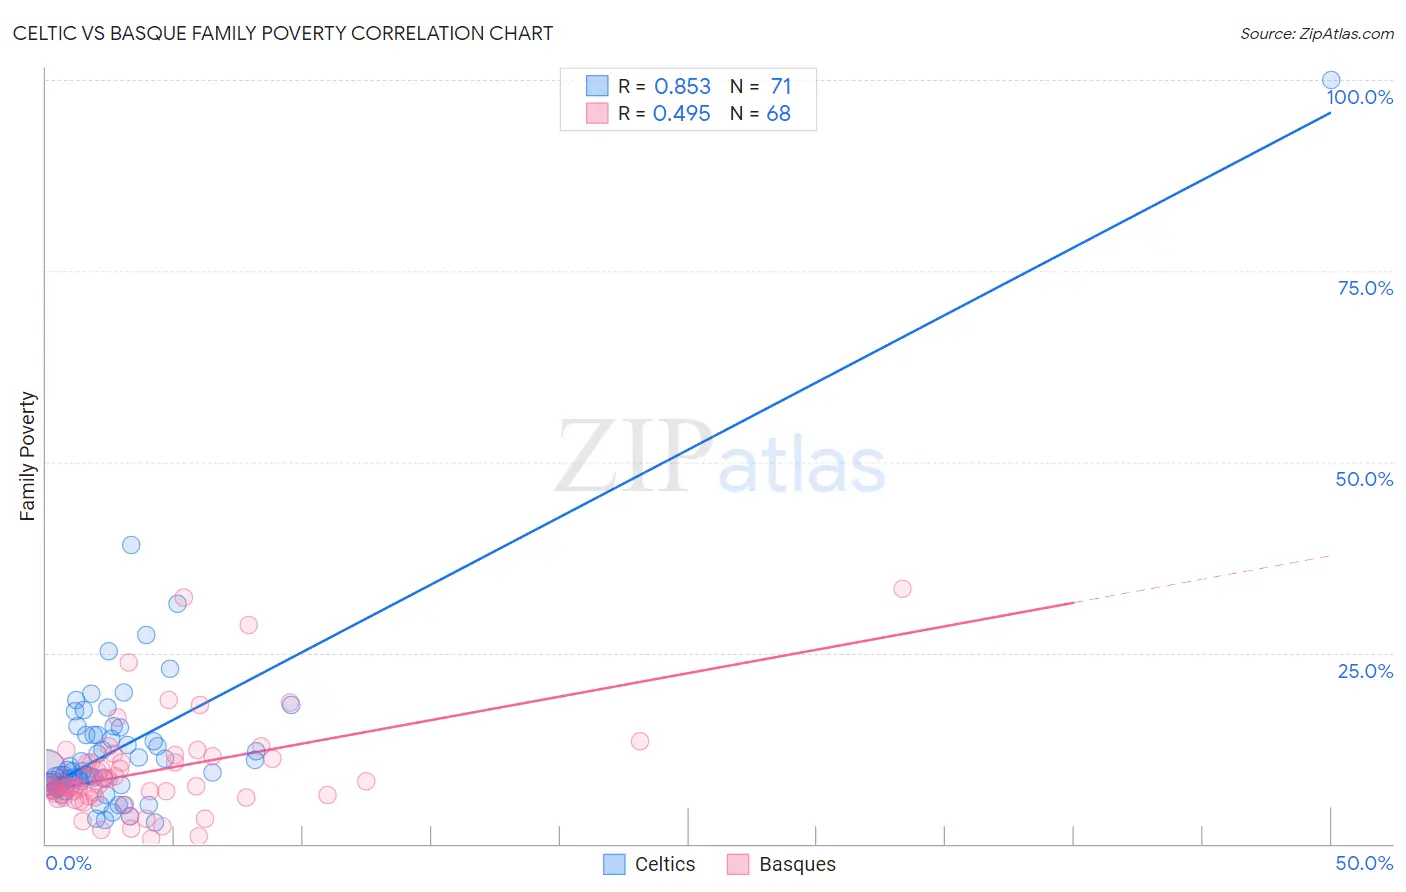
Celtic vs Basque Family Poverty Correlation Chart
The statistical analysis conducted on geographies consisting of 168,628,915 people shows a very strong positive correlation between the proportion of Celtics and poverty level among families in the United States with a correlation coefficient (R) of 0.853 and weighted average of 8.8%. Similarly, the statistical analysis conducted on geographies consisting of 165,603,932 people shows a moderate positive correlation between the proportion of Basques and poverty level among families in the United States with a correlation coefficient (R) of 0.495 and weighted average of 8.1%, a difference of 8.4%.
Family Poverty Correlation Summary
| Measurement | Celtic | Basque |
| Minimum | 2.8% | 0.66% |
| Maximum | 100.0% | 33.3% |
| Range | 97.2% | 32.7% |
| Mean | 12.7% | 9.4% |
| Median | 9.4% | 7.6% |
| Interquartile 25% (IQ1) | 7.6% | 6.2% |
| Interquartile 75% (IQ3) | 14.2% | 10.9% |
| Interquartile Range (IQR) | 6.6% | 4.8% |
| Standard Deviation (Sample) | 12.4% | 6.4% |
| Standard Deviation (Population) | 12.3% | 6.3% |
Similar Demographics by Family Poverty
Demographics Similar to Celtics by Family Poverty
In terms of family poverty, the demographic groups most similar to Celtics are Guamanian/Chamorro (8.8%, a difference of 0.030%), Pennsylvania German (8.8%, a difference of 0.16%), Ethiopian (8.8%, a difference of 0.21%), Afghan (8.8%, a difference of 0.21%), and Immigrants from Northern Africa (8.8%, a difference of 0.30%).
| Demographics | Rating | Rank | Family Poverty |
| Tsimshian | 69.3 /100 | #157 | Good 8.8% |
| Whites/Caucasians | 69.1 /100 | #158 | Good 8.8% |
| Peruvians | 68.0 /100 | #159 | Good 8.8% |
| Hungarians | 67.2 /100 | #160 | Good 8.8% |
| Immigrants | Northern Africa | 66.9 /100 | #161 | Good 8.8% |
| Ethiopians | 66.3 /100 | #162 | Good 8.8% |
| Pennsylvania Germans | 66.0 /100 | #163 | Good 8.8% |
| Celtics | 64.9 /100 | #164 | Good 8.8% |
| Guamanians/Chamorros | 64.7 /100 | #165 | Good 8.8% |
| Afghans | 63.5 /100 | #166 | Good 8.8% |
| Immigrants | Ethiopia | 62.5 /100 | #167 | Good 8.9% |
| Israelis | 62.1 /100 | #168 | Good 8.9% |
| Immigrants | Chile | 59.6 /100 | #169 | Average 8.9% |
| Kenyans | 58.2 /100 | #170 | Average 8.9% |
| Lebanese | 57.6 /100 | #171 | Average 8.9% |
Demographics Similar to Basques by Family Poverty
In terms of family poverty, the demographic groups most similar to Basques are French Canadian (8.1%, a difference of 0.090%), Jordanian (8.2%, a difference of 0.090%), Egyptian (8.1%, a difference of 0.13%), Romanian (8.2%, a difference of 0.18%), and Taiwanese (8.2%, a difference of 0.23%).
| Demographics | Rating | Rank | Family Poverty |
| Immigrants | Norway | 95.7 /100 | #101 | Exceptional 8.1% |
| Immigrants | Indonesia | 95.7 /100 | #102 | Exceptional 8.1% |
| Immigrants | Eastern Europe | 95.6 /100 | #103 | Exceptional 8.1% |
| Slavs | 95.6 /100 | #104 | Exceptional 8.1% |
| Laotians | 95.6 /100 | #105 | Exceptional 8.1% |
| Egyptians | 95.1 /100 | #106 | Exceptional 8.1% |
| French Canadians | 95.0 /100 | #107 | Exceptional 8.1% |
| Basques | 94.9 /100 | #108 | Exceptional 8.1% |
| Jordanians | 94.8 /100 | #109 | Exceptional 8.2% |
| Romanians | 94.7 /100 | #110 | Exceptional 8.2% |
| Taiwanese | 94.6 /100 | #111 | Exceptional 8.2% |
| Immigrants | France | 94.4 /100 | #112 | Exceptional 8.2% |
| Canadians | 94.2 /100 | #113 | Exceptional 8.2% |
| Immigrants | Zimbabwe | 94.0 /100 | #114 | Exceptional 8.2% |
| Immigrants | Israel | 93.5 /100 | #115 | Exceptional 8.2% |