Canadian vs Immigrants from Korea Female Poverty
COMPARE
Canadian
Immigrants from Korea
Female Poverty
Female Poverty Comparison
Canadians
Immigrants from Korea
12.7%
FEMALE POVERTY
92.0/ 100
METRIC RATING
113th/ 347
METRIC RANK
11.7%
FEMALE POVERTY
99.6/ 100
METRIC RATING
28th/ 347
METRIC RANK
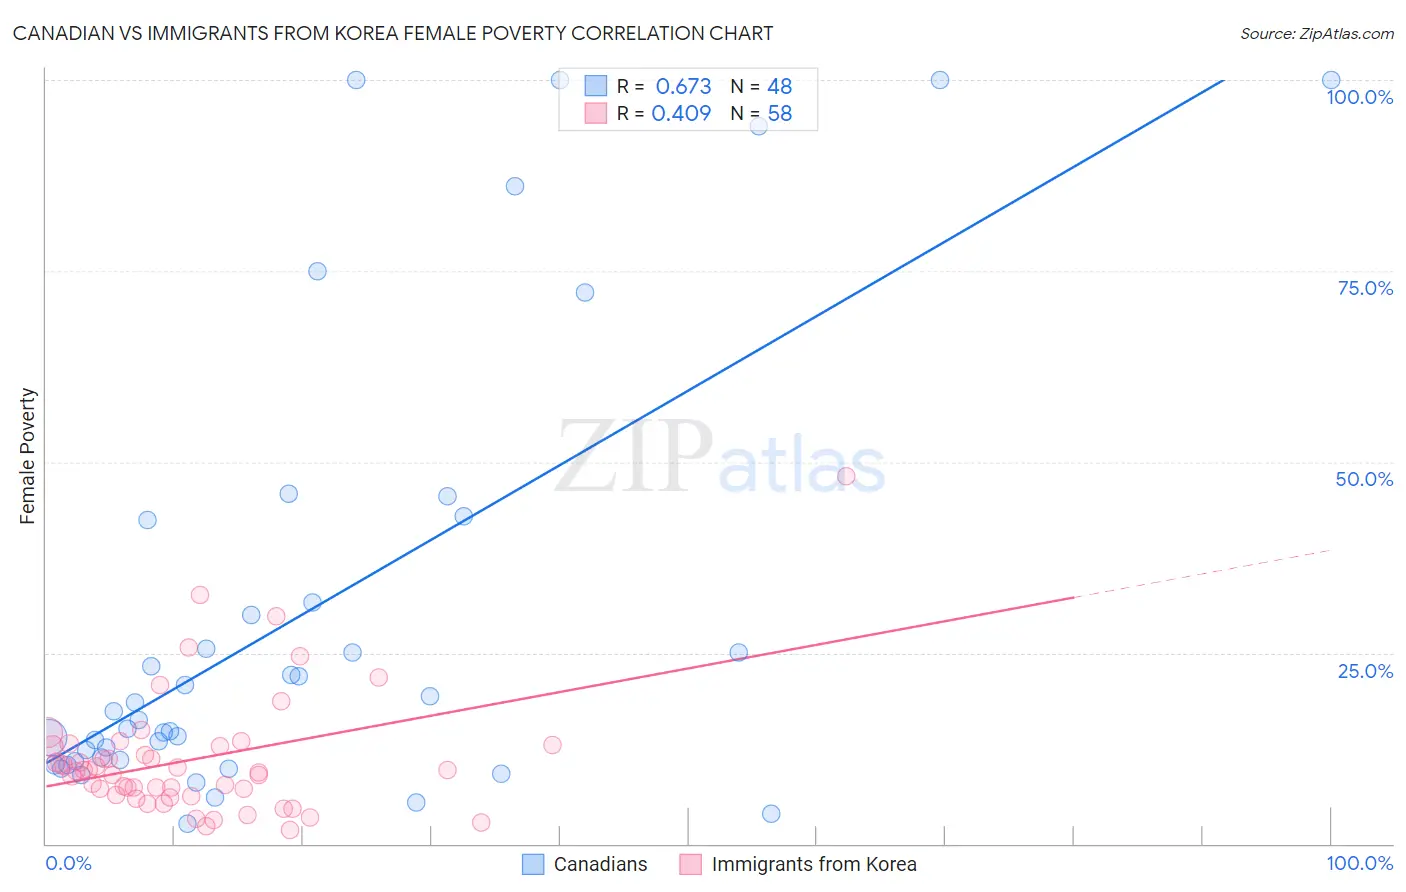
Canadian vs Immigrants from Korea Female Poverty Correlation Chart
The statistical analysis conducted on geographies consisting of 437,154,651 people shows a significant positive correlation between the proportion of Canadians and poverty level among females in the United States with a correlation coefficient (R) of 0.673 and weighted average of 12.7%. Similarly, the statistical analysis conducted on geographies consisting of 415,882,145 people shows a moderate positive correlation between the proportion of Immigrants from Korea and poverty level among females in the United States with a correlation coefficient (R) of 0.409 and weighted average of 11.7%, a difference of 8.4%.
Female Poverty Correlation Summary
| Measurement | Canadian | Immigrants from Korea |
| Minimum | 2.7% | 1.7% |
| Maximum | 100.0% | 48.2% |
| Range | 97.3% | 46.5% |
| Mean | 30.0% | 11.1% |
| Median | 16.8% | 9.6% |
| Interquartile 25% (IQ1) | 10.9% | 6.4% |
| Interquartile 75% (IQ3) | 37.0% | 12.8% |
| Interquartile Range (IQR) | 26.0% | 6.5% |
| Standard Deviation (Sample) | 29.7% | 8.1% |
| Standard Deviation (Population) | 29.4% | 8.1% |
Similar Demographics by Female Poverty
Demographics Similar to Canadians by Female Poverty
In terms of female poverty, the demographic groups most similar to Canadians are Immigrants from Israel (12.6%, a difference of 0.030%), Welsh (12.7%, a difference of 0.12%), Puget Sound Salish (12.7%, a difference of 0.14%), Soviet Union (12.6%, a difference of 0.17%), and Immigrants from Russia (12.7%, a difference of 0.26%).
| Demographics | Rating | Rank | Female Poverty |
| Immigrants | Turkey | 93.8 /100 | #106 | Exceptional 12.6% |
| Laotians | 93.4 /100 | #107 | Exceptional 12.6% |
| Portuguese | 93.1 /100 | #108 | Exceptional 12.6% |
| Immigrants | Zimbabwe | 93.1 /100 | #109 | Exceptional 12.6% |
| Paraguayans | 93.0 /100 | #110 | Exceptional 12.6% |
| Soviet Union | 92.4 /100 | #111 | Exceptional 12.6% |
| Immigrants | Israel | 92.0 /100 | #112 | Exceptional 12.6% |
| Canadians | 92.0 /100 | #113 | Exceptional 12.7% |
| Welsh | 91.6 /100 | #114 | Exceptional 12.7% |
| Puget Sound Salish | 91.5 /100 | #115 | Exceptional 12.7% |
| Immigrants | Russia | 91.2 /100 | #116 | Exceptional 12.7% |
| Immigrants | Southern Europe | 90.9 /100 | #117 | Exceptional 12.7% |
| Sri Lankans | 90.9 /100 | #118 | Exceptional 12.7% |
| Albanians | 90.8 /100 | #119 | Exceptional 12.7% |
| New Zealanders | 90.6 /100 | #120 | Exceptional 12.7% |
Demographics Similar to Immigrants from Korea by Female Poverty
In terms of female poverty, the demographic groups most similar to Immigrants from Korea are Immigrants from North Macedonia (11.7%, a difference of 0.15%), Iranian (11.7%, a difference of 0.21%), Greek (11.7%, a difference of 0.23%), Immigrants from Northern Europe (11.6%, a difference of 0.32%), and Croatian (11.6%, a difference of 0.32%).
| Demographics | Rating | Rank | Female Poverty |
| Italians | 99.7 /100 | #21 | Exceptional 11.6% |
| Swedes | 99.7 /100 | #22 | Exceptional 11.6% |
| Burmese | 99.7 /100 | #23 | Exceptional 11.6% |
| Luxembourgers | 99.7 /100 | #24 | Exceptional 11.6% |
| Immigrants | Northern Europe | 99.6 /100 | #25 | Exceptional 11.6% |
| Croatians | 99.6 /100 | #26 | Exceptional 11.6% |
| Iranians | 99.6 /100 | #27 | Exceptional 11.7% |
| Immigrants | Korea | 99.6 /100 | #28 | Exceptional 11.7% |
| Immigrants | North Macedonia | 99.6 /100 | #29 | Exceptional 11.7% |
| Greeks | 99.5 /100 | #30 | Exceptional 11.7% |
| Poles | 99.5 /100 | #31 | Exceptional 11.7% |
| Danes | 99.5 /100 | #32 | Exceptional 11.7% |
| Cypriots | 99.5 /100 | #33 | Exceptional 11.8% |
| Immigrants | Singapore | 99.4 /100 | #34 | Exceptional 11.8% |
| Immigrants | Iran | 99.4 /100 | #35 | Exceptional 11.8% |