Canadian vs Jordanian Female Poverty
COMPARE
Canadian
Jordanian
Female Poverty
Female Poverty Comparison
Canadians
Jordanians
12.7%
FEMALE POVERTY
92.0/ 100
METRIC RATING
113th/ 347
METRIC RANK
12.3%
FEMALE POVERTY
97.1/ 100
METRIC RATING
82nd/ 347
METRIC RANK
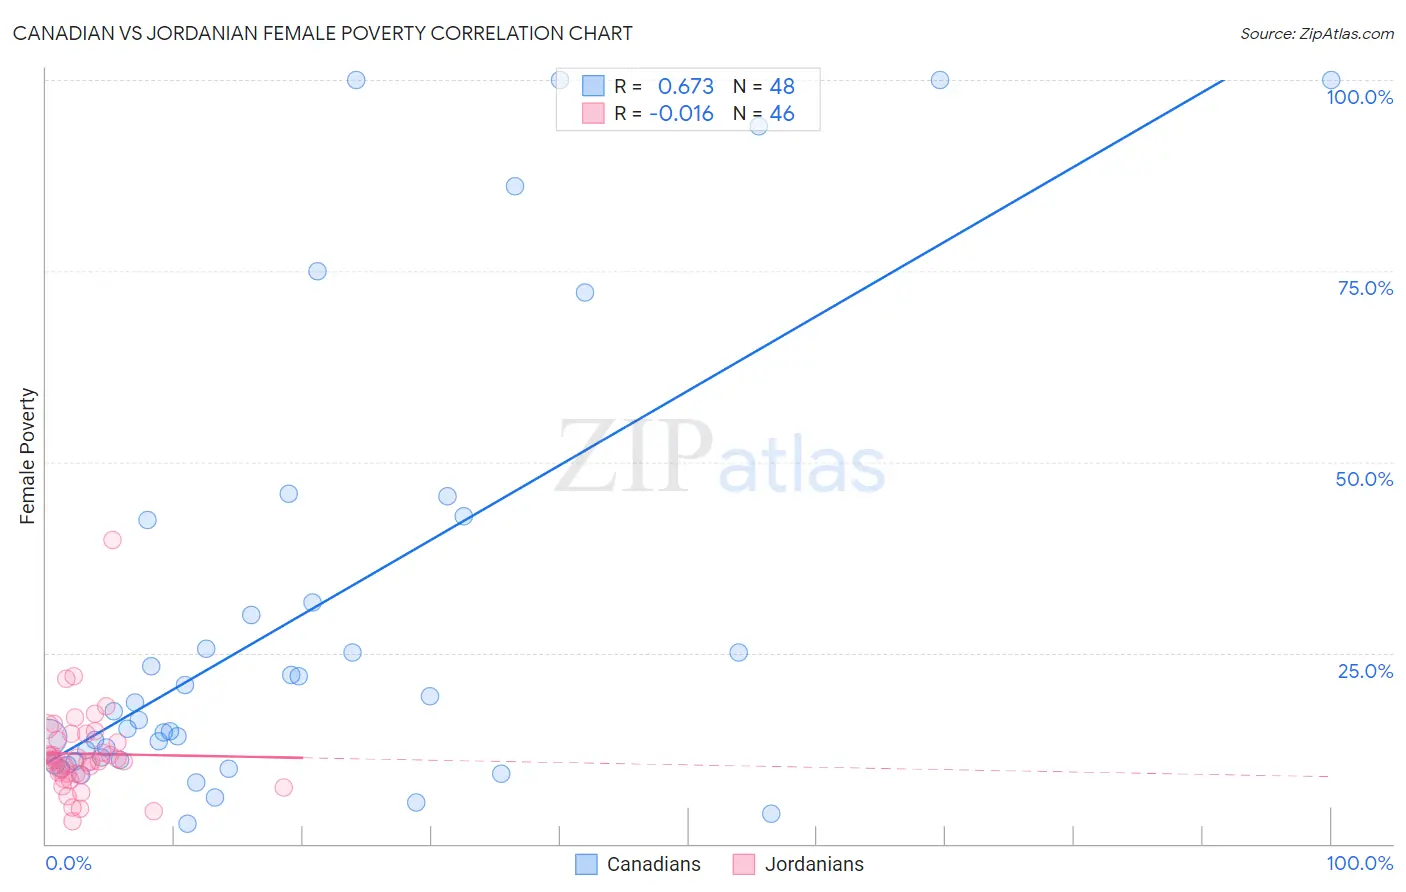
Canadian vs Jordanian Female Poverty Correlation Chart
The statistical analysis conducted on geographies consisting of 437,154,651 people shows a significant positive correlation between the proportion of Canadians and poverty level among females in the United States with a correlation coefficient (R) of 0.673 and weighted average of 12.7%. Similarly, the statistical analysis conducted on geographies consisting of 166,392,189 people shows no correlation between the proportion of Jordanians and poverty level among females in the United States with a correlation coefficient (R) of -0.016 and weighted average of 12.3%, a difference of 2.8%.
Female Poverty Correlation Summary
| Measurement | Canadian | Jordanian |
| Minimum | 2.7% | 2.9% |
| Maximum | 100.0% | 39.7% |
| Range | 97.3% | 36.8% |
| Mean | 30.0% | 11.8% |
| Median | 16.8% | 10.9% |
| Interquartile 25% (IQ1) | 10.9% | 9.1% |
| Interquartile 75% (IQ3) | 37.0% | 13.6% |
| Interquartile Range (IQR) | 26.0% | 4.5% |
| Standard Deviation (Sample) | 29.7% | 5.8% |
| Standard Deviation (Population) | 29.4% | 5.8% |
Similar Demographics by Female Poverty
Demographics Similar to Canadians by Female Poverty
In terms of female poverty, the demographic groups most similar to Canadians are Immigrants from Israel (12.6%, a difference of 0.030%), Welsh (12.7%, a difference of 0.12%), Puget Sound Salish (12.7%, a difference of 0.14%), Soviet Union (12.6%, a difference of 0.17%), and Immigrants from Russia (12.7%, a difference of 0.26%).
| Demographics | Rating | Rank | Female Poverty |
| Immigrants | Turkey | 93.8 /100 | #106 | Exceptional 12.6% |
| Laotians | 93.4 /100 | #107 | Exceptional 12.6% |
| Portuguese | 93.1 /100 | #108 | Exceptional 12.6% |
| Immigrants | Zimbabwe | 93.1 /100 | #109 | Exceptional 12.6% |
| Paraguayans | 93.0 /100 | #110 | Exceptional 12.6% |
| Soviet Union | 92.4 /100 | #111 | Exceptional 12.6% |
| Immigrants | Israel | 92.0 /100 | #112 | Exceptional 12.6% |
| Canadians | 92.0 /100 | #113 | Exceptional 12.7% |
| Welsh | 91.6 /100 | #114 | Exceptional 12.7% |
| Puget Sound Salish | 91.5 /100 | #115 | Exceptional 12.7% |
| Immigrants | Russia | 91.2 /100 | #116 | Exceptional 12.7% |
| Immigrants | Southern Europe | 90.9 /100 | #117 | Exceptional 12.7% |
| Sri Lankans | 90.9 /100 | #118 | Exceptional 12.7% |
| Albanians | 90.8 /100 | #119 | Exceptional 12.7% |
| New Zealanders | 90.6 /100 | #120 | Exceptional 12.7% |
Demographics Similar to Jordanians by Female Poverty
In terms of female poverty, the demographic groups most similar to Jordanians are Slovak (12.3%, a difference of 0.010%), Immigrants from Sweden (12.3%, a difference of 0.010%), Immigrants from North America (12.3%, a difference of 0.060%), Egyptian (12.3%, a difference of 0.13%), and Serbian (12.3%, a difference of 0.14%).
| Demographics | Rating | Rank | Female Poverty |
| Europeans | 97.4 /100 | #75 | Exceptional 12.3% |
| Immigrants | Eastern Europe | 97.2 /100 | #76 | Exceptional 12.3% |
| Serbians | 97.2 /100 | #77 | Exceptional 12.3% |
| Egyptians | 97.2 /100 | #78 | Exceptional 12.3% |
| Immigrants | North America | 97.1 /100 | #79 | Exceptional 12.3% |
| Slovaks | 97.1 /100 | #80 | Exceptional 12.3% |
| Immigrants | Sweden | 97.1 /100 | #81 | Exceptional 12.3% |
| Jordanians | 97.1 /100 | #82 | Exceptional 12.3% |
| Immigrants | England | 96.9 /100 | #83 | Exceptional 12.3% |
| Northern Europeans | 96.6 /100 | #84 | Exceptional 12.4% |
| Irish | 96.5 /100 | #85 | Exceptional 12.4% |
| Dutch | 96.5 /100 | #86 | Exceptional 12.4% |
| Okinawans | 96.4 /100 | #87 | Exceptional 12.4% |
| Finns | 96.4 /100 | #88 | Exceptional 12.4% |
| English | 96.1 /100 | #89 | Exceptional 12.4% |