Canadian vs Immigrants from Korea In Labor Force | Age 35-44
COMPARE
Canadian
Immigrants from Korea
In Labor Force | Age 35-44
In Labor Force | Age 35-44 Comparison
Canadians
Immigrants from Korea
84.2%
IN LABOR FORCE | AGE 35-44
19.9/ 100
METRIC RATING
204th/ 347
METRIC RANK
84.6%
IN LABOR FORCE | AGE 35-44
88.2/ 100
METRIC RATING
134th/ 347
METRIC RANK
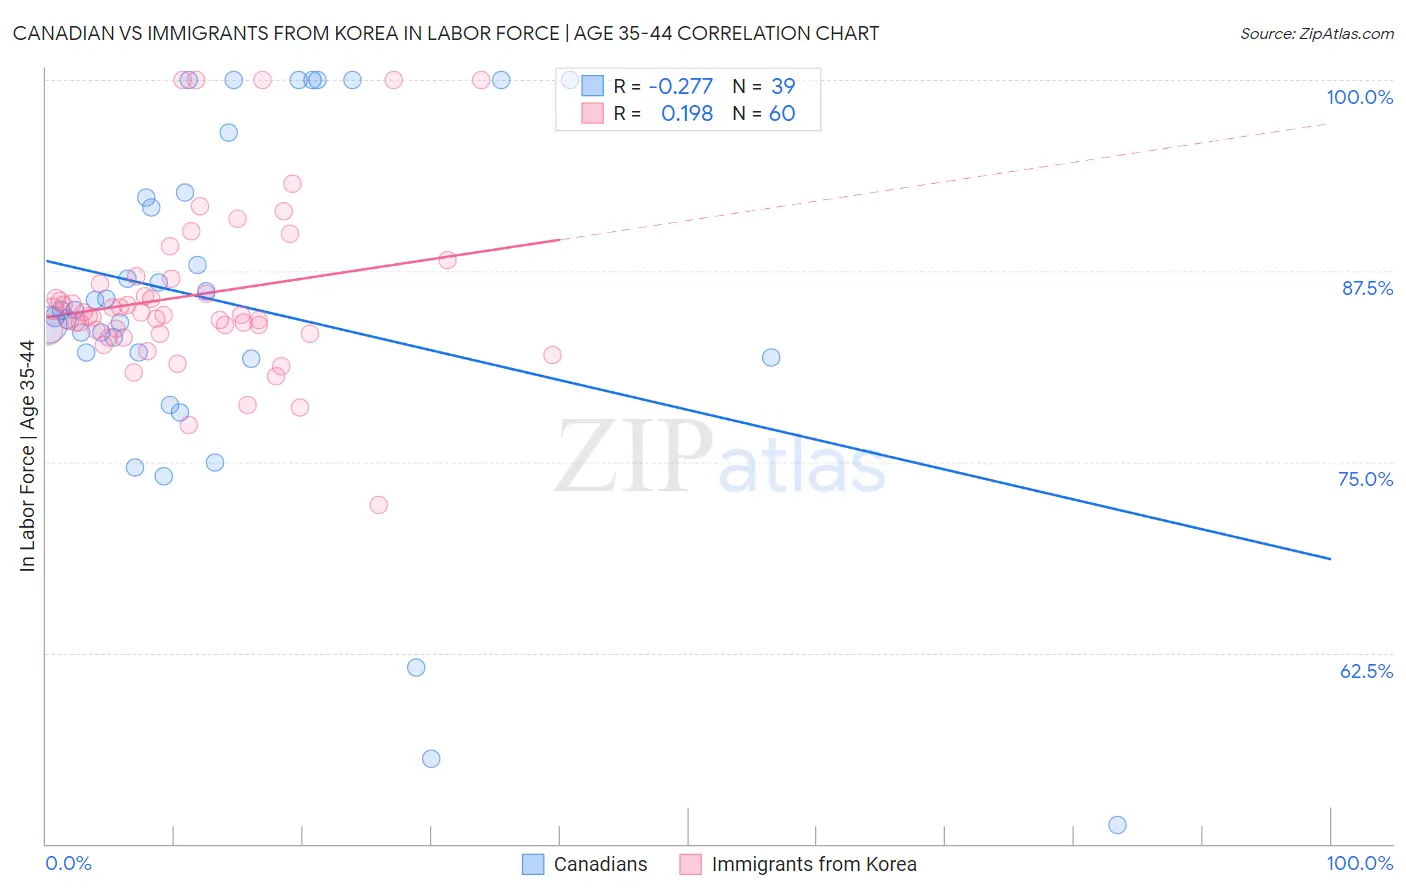
Canadian vs Immigrants from Korea In Labor Force | Age 35-44 Correlation Chart
The statistical analysis conducted on geographies consisting of 437,310,598 people shows a weak negative correlation between the proportion of Canadians and labor force participation rate among population between the ages 35 and 44 in the United States with a correlation coefficient (R) of -0.277 and weighted average of 84.2%. Similarly, the statistical analysis conducted on geographies consisting of 416,059,040 people shows a poor positive correlation between the proportion of Immigrants from Korea and labor force participation rate among population between the ages 35 and 44 in the United States with a correlation coefficient (R) of 0.198 and weighted average of 84.6%, a difference of 0.55%.
In Labor Force | Age 35-44 Correlation Summary
| Measurement | Canadian | Immigrants from Korea |
| Minimum | 51.2% | 72.2% |
| Maximum | 100.0% | 100.0% |
| Range | 48.8% | 27.8% |
| Mean | 85.3% | 85.9% |
| Median | 84.9% | 84.6% |
| Interquartile 25% (IQ1) | 81.8% | 83.5% |
| Interquartile 75% (IQ3) | 92.7% | 86.9% |
| Interquartile Range (IQR) | 10.9% | 3.3% |
| Standard Deviation (Sample) | 11.6% | 5.5% |
| Standard Deviation (Population) | 11.5% | 5.4% |
Similar Demographics by In Labor Force | Age 35-44
Demographics Similar to Canadians by In Labor Force | Age 35-44
In terms of in labor force | age 35-44, the demographic groups most similar to Canadians are Immigrants from Canada (84.2%, a difference of 0.0%), Immigrants from Costa Rica (84.2%, a difference of 0.0%), Laotian (84.2%, a difference of 0.010%), Immigrants from South Eastern Asia (84.2%, a difference of 0.020%), and Immigrants from North America (84.2%, a difference of 0.020%).
| Demographics | Rating | Rank | In Labor Force | Age 35-44 |
| Immigrants | Western Europe | 24.7 /100 | #197 | Fair 84.2% |
| Ecuadorians | 24.0 /100 | #198 | Fair 84.2% |
| Syrians | 23.2 /100 | #199 | Fair 84.2% |
| Moroccans | 23.2 /100 | #200 | Fair 84.2% |
| British | 23.0 /100 | #201 | Fair 84.2% |
| Immigrants | Uzbekistan | 22.8 /100 | #202 | Fair 84.2% |
| Immigrants | South Eastern Asia | 22.4 /100 | #203 | Fair 84.2% |
| Canadians | 19.9 /100 | #204 | Poor 84.2% |
| Immigrants | Canada | 19.6 /100 | #205 | Poor 84.2% |
| Immigrants | Costa Rica | 19.5 /100 | #206 | Poor 84.2% |
| Laotians | 19.0 /100 | #207 | Poor 84.2% |
| Immigrants | North America | 18.1 /100 | #208 | Poor 84.2% |
| Swiss | 17.4 /100 | #209 | Poor 84.2% |
| New Zealanders | 16.2 /100 | #210 | Poor 84.1% |
| Immigrants | Ecuador | 15.2 /100 | #211 | Poor 84.1% |
Demographics Similar to Immigrants from Korea by In Labor Force | Age 35-44
In terms of in labor force | age 35-44, the demographic groups most similar to Immigrants from Korea are Argentinean (84.6%, a difference of 0.0%), Immigrants from Malaysia (84.6%, a difference of 0.010%), Palestinian (84.7%, a difference of 0.020%), Bhutanese (84.7%, a difference of 0.020%), and Immigrants from Scotland (84.7%, a difference of 0.020%).
| Demographics | Rating | Rank | In Labor Force | Age 35-44 |
| Immigrants | Spain | 90.6 /100 | #127 | Exceptional 84.7% |
| Immigrants | Ghana | 90.4 /100 | #128 | Exceptional 84.7% |
| Palestinians | 89.7 /100 | #129 | Excellent 84.7% |
| Bhutanese | 89.7 /100 | #130 | Excellent 84.7% |
| Immigrants | Scotland | 89.6 /100 | #131 | Excellent 84.7% |
| Austrians | 89.4 /100 | #132 | Excellent 84.7% |
| Argentineans | 88.4 /100 | #133 | Excellent 84.6% |
| Immigrants | Korea | 88.2 /100 | #134 | Excellent 84.6% |
| Immigrants | Malaysia | 87.5 /100 | #135 | Excellent 84.6% |
| Afghans | 86.3 /100 | #136 | Excellent 84.6% |
| Immigrants | Chile | 84.6 /100 | #137 | Excellent 84.6% |
| Czechoslovakians | 82.6 /100 | #138 | Excellent 84.6% |
| Immigrants | Zaire | 82.5 /100 | #139 | Excellent 84.6% |
| Immigrants | Japan | 81.4 /100 | #140 | Excellent 84.6% |
| Immigrants | Belgium | 80.8 /100 | #141 | Excellent 84.6% |