Bahamian vs Immigrants from Korea Female Poverty
COMPARE
Bahamian
Immigrants from Korea
Female Poverty
Female Poverty Comparison
Bahamians
Immigrants from Korea
16.6%
FEMALE POVERTY
0.0/ 100
METRIC RATING
300th/ 347
METRIC RANK
11.7%
FEMALE POVERTY
99.6/ 100
METRIC RATING
28th/ 347
METRIC RANK
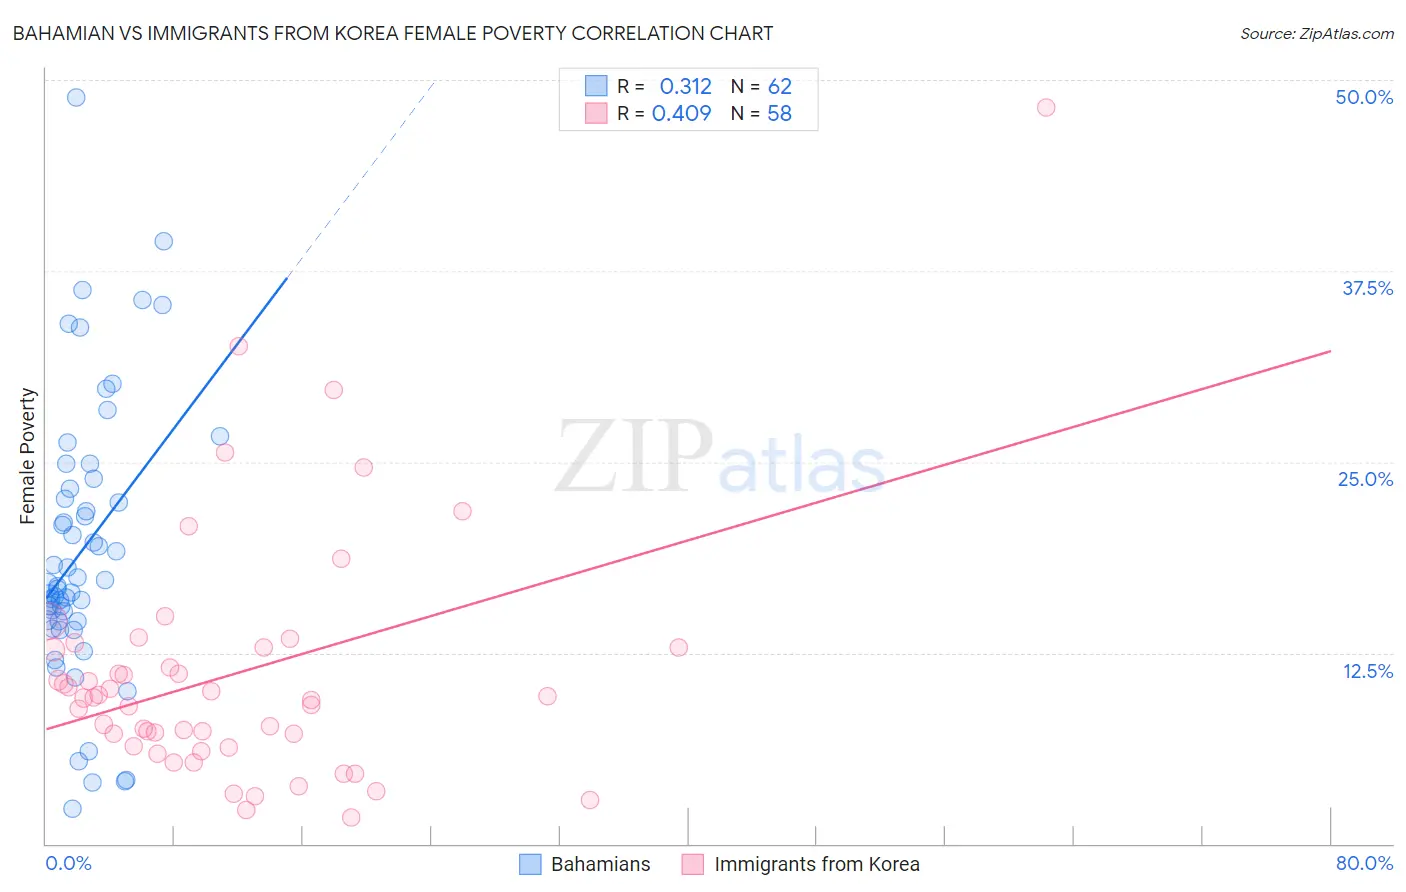
Bahamian vs Immigrants from Korea Female Poverty Correlation Chart
The statistical analysis conducted on geographies consisting of 112,629,599 people shows a mild positive correlation between the proportion of Bahamians and poverty level among females in the United States with a correlation coefficient (R) of 0.312 and weighted average of 16.6%. Similarly, the statistical analysis conducted on geographies consisting of 415,882,145 people shows a moderate positive correlation between the proportion of Immigrants from Korea and poverty level among females in the United States with a correlation coefficient (R) of 0.409 and weighted average of 11.7%, a difference of 42.6%.
Female Poverty Correlation Summary
| Measurement | Bahamian | Immigrants from Korea |
| Minimum | 2.3% | 1.7% |
| Maximum | 48.8% | 48.2% |
| Range | 46.5% | 46.5% |
| Mean | 19.2% | 11.1% |
| Median | 16.9% | 9.6% |
| Interquartile 25% (IQ1) | 14.6% | 6.4% |
| Interquartile 75% (IQ3) | 23.2% | 12.8% |
| Interquartile Range (IQR) | 8.7% | 6.5% |
| Standard Deviation (Sample) | 9.1% | 8.1% |
| Standard Deviation (Population) | 9.0% | 8.1% |
Similar Demographics by Female Poverty
Demographics Similar to Bahamians by Female Poverty
In terms of female poverty, the demographic groups most similar to Bahamians are Hispanic or Latino (16.6%, a difference of 0.040%), Guatemalan (16.7%, a difference of 0.33%), Chippewa (16.7%, a difference of 0.36%), Somali (16.6%, a difference of 0.56%), and Mexican (16.5%, a difference of 0.77%).
| Demographics | Rating | Rank | Female Poverty |
| Immigrants | Latin America | 0.0 /100 | #293 | Tragic 16.4% |
| Immigrants | Cabo Verde | 0.0 /100 | #294 | Tragic 16.4% |
| Senegalese | 0.0 /100 | #295 | Tragic 16.5% |
| Immigrants | Senegal | 0.0 /100 | #296 | Tragic 16.5% |
| Mexicans | 0.0 /100 | #297 | Tragic 16.5% |
| Somalis | 0.0 /100 | #298 | Tragic 16.6% |
| Hispanics or Latinos | 0.0 /100 | #299 | Tragic 16.6% |
| Bahamians | 0.0 /100 | #300 | Tragic 16.6% |
| Guatemalans | 0.0 /100 | #301 | Tragic 16.7% |
| Chippewa | 0.0 /100 | #302 | Tragic 16.7% |
| Choctaw | 0.0 /100 | #303 | Tragic 16.8% |
| Immigrants | Central America | 0.0 /100 | #304 | Tragic 16.8% |
| Immigrants | Grenada | 0.0 /100 | #305 | Tragic 16.8% |
| Immigrants | Caribbean | 0.0 /100 | #306 | Tragic 16.9% |
| Seminole | 0.0 /100 | #307 | Tragic 16.9% |
Demographics Similar to Immigrants from Korea by Female Poverty
In terms of female poverty, the demographic groups most similar to Immigrants from Korea are Immigrants from North Macedonia (11.7%, a difference of 0.15%), Iranian (11.7%, a difference of 0.21%), Greek (11.7%, a difference of 0.23%), Immigrants from Northern Europe (11.6%, a difference of 0.32%), and Croatian (11.6%, a difference of 0.32%).
| Demographics | Rating | Rank | Female Poverty |
| Italians | 99.7 /100 | #21 | Exceptional 11.6% |
| Swedes | 99.7 /100 | #22 | Exceptional 11.6% |
| Burmese | 99.7 /100 | #23 | Exceptional 11.6% |
| Luxembourgers | 99.7 /100 | #24 | Exceptional 11.6% |
| Immigrants | Northern Europe | 99.6 /100 | #25 | Exceptional 11.6% |
| Croatians | 99.6 /100 | #26 | Exceptional 11.6% |
| Iranians | 99.6 /100 | #27 | Exceptional 11.7% |
| Immigrants | Korea | 99.6 /100 | #28 | Exceptional 11.7% |
| Immigrants | North Macedonia | 99.6 /100 | #29 | Exceptional 11.7% |
| Greeks | 99.5 /100 | #30 | Exceptional 11.7% |
| Poles | 99.5 /100 | #31 | Exceptional 11.7% |
| Danes | 99.5 /100 | #32 | Exceptional 11.7% |
| Cypriots | 99.5 /100 | #33 | Exceptional 11.8% |
| Immigrants | Singapore | 99.4 /100 | #34 | Exceptional 11.8% |
| Immigrants | Iran | 99.4 /100 | #35 | Exceptional 11.8% |