Yakama vs Immigrants from Korea Female Poverty
COMPARE
Yakama
Immigrants from Korea
Female Poverty
Female Poverty Comparison
Yakama
Immigrants from Korea
18.0%
FEMALE POVERTY
0.0/ 100
METRIC RATING
327th/ 347
METRIC RANK
11.7%
FEMALE POVERTY
99.6/ 100
METRIC RATING
28th/ 347
METRIC RANK
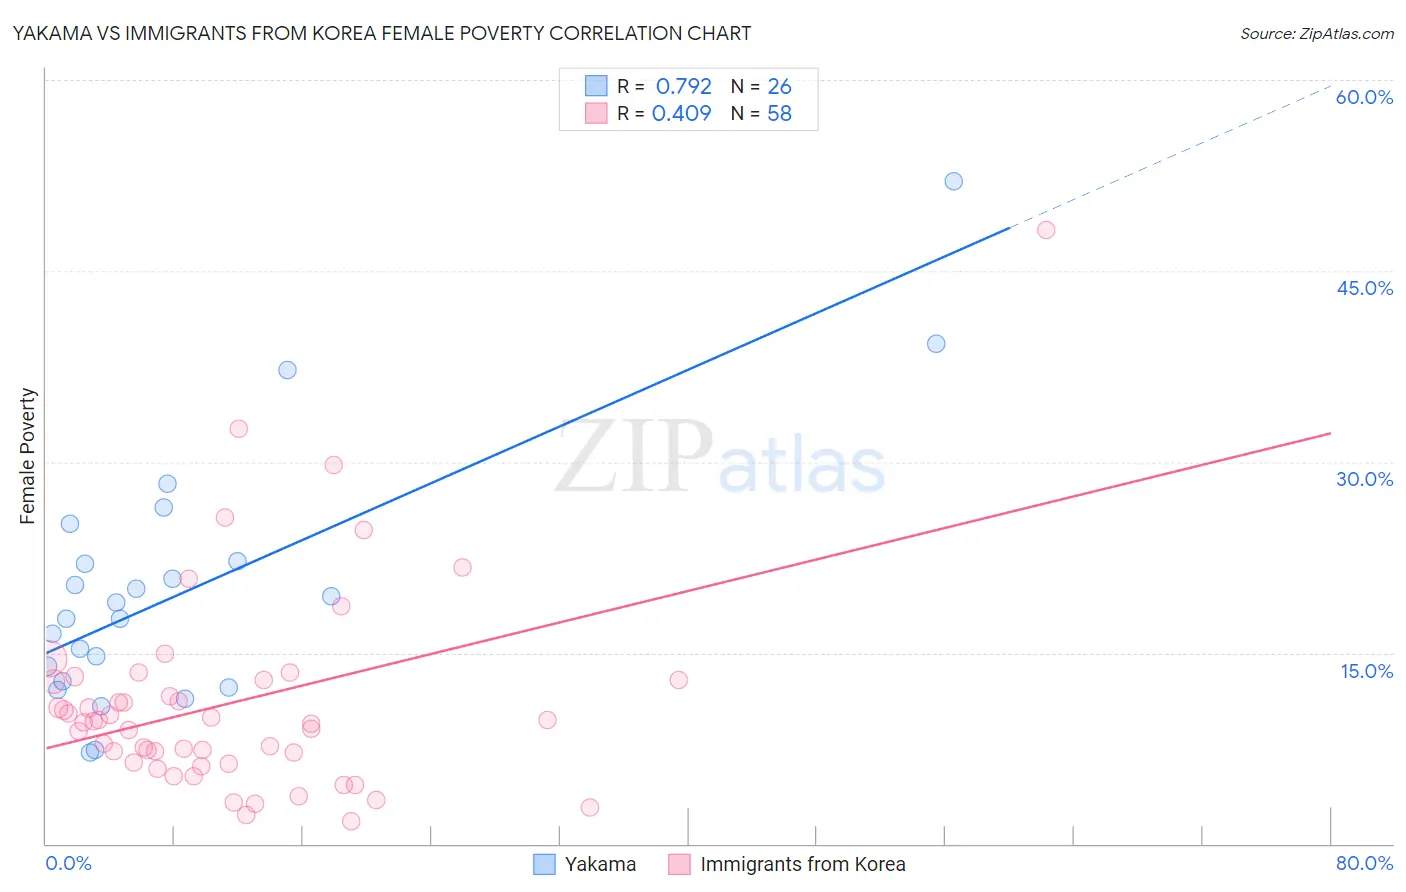
Yakama vs Immigrants from Korea Female Poverty Correlation Chart
The statistical analysis conducted on geographies consisting of 19,917,707 people shows a strong positive correlation between the proportion of Yakama and poverty level among females in the United States with a correlation coefficient (R) of 0.792 and weighted average of 18.0%. Similarly, the statistical analysis conducted on geographies consisting of 415,882,145 people shows a moderate positive correlation between the proportion of Immigrants from Korea and poverty level among females in the United States with a correlation coefficient (R) of 0.409 and weighted average of 11.7%, a difference of 54.5%.
Female Poverty Correlation Summary
| Measurement | Yakama | Immigrants from Korea |
| Minimum | 7.1% | 1.7% |
| Maximum | 52.1% | 48.2% |
| Range | 44.9% | 46.5% |
| Mean | 20.1% | 11.1% |
| Median | 18.4% | 9.6% |
| Interquartile 25% (IQ1) | 12.8% | 6.4% |
| Interquartile 75% (IQ3) | 22.2% | 12.8% |
| Interquartile Range (IQR) | 9.5% | 6.5% |
| Standard Deviation (Sample) | 10.2% | 8.1% |
| Standard Deviation (Population) | 10.0% | 8.1% |
Similar Demographics by Female Poverty
Demographics Similar to Yakama by Female Poverty
In terms of female poverty, the demographic groups most similar to Yakama are Central American Indian (18.0%, a difference of 0.10%), Colville (17.8%, a difference of 1.6%), Immigrants from Honduras (17.7%, a difference of 1.8%), Paiute (17.7%, a difference of 2.0%), and Menominee (17.6%, a difference of 2.6%).
| Demographics | Rating | Rank | Female Poverty |
| Immigrants | Dominica | 0.0 /100 | #320 | Tragic 17.5% |
| Arapaho | 0.0 /100 | #321 | Tragic 17.5% |
| Menominee | 0.0 /100 | #322 | Tragic 17.6% |
| Paiute | 0.0 /100 | #323 | Tragic 17.7% |
| Immigrants | Honduras | 0.0 /100 | #324 | Tragic 17.7% |
| Colville | 0.0 /100 | #325 | Tragic 17.8% |
| Central American Indians | 0.0 /100 | #326 | Tragic 18.0% |
| Yakama | 0.0 /100 | #327 | Tragic 18.0% |
| Blacks/African Americans | 0.0 /100 | #328 | Tragic 18.6% |
| Kiowa | 0.0 /100 | #329 | Tragic 18.6% |
| Dominicans | 0.0 /100 | #330 | Tragic 19.1% |
| Natives/Alaskans | 0.0 /100 | #331 | Tragic 19.2% |
| Apache | 0.0 /100 | #332 | Tragic 19.2% |
| Immigrants | Dominican Republic | 0.0 /100 | #333 | Tragic 19.3% |
| Houma | 0.0 /100 | #334 | Tragic 20.0% |
Demographics Similar to Immigrants from Korea by Female Poverty
In terms of female poverty, the demographic groups most similar to Immigrants from Korea are Immigrants from North Macedonia (11.7%, a difference of 0.15%), Iranian (11.7%, a difference of 0.21%), Greek (11.7%, a difference of 0.23%), Immigrants from Northern Europe (11.6%, a difference of 0.32%), and Croatian (11.6%, a difference of 0.32%).
| Demographics | Rating | Rank | Female Poverty |
| Italians | 99.7 /100 | #21 | Exceptional 11.6% |
| Swedes | 99.7 /100 | #22 | Exceptional 11.6% |
| Burmese | 99.7 /100 | #23 | Exceptional 11.6% |
| Luxembourgers | 99.7 /100 | #24 | Exceptional 11.6% |
| Immigrants | Northern Europe | 99.6 /100 | #25 | Exceptional 11.6% |
| Croatians | 99.6 /100 | #26 | Exceptional 11.6% |
| Iranians | 99.6 /100 | #27 | Exceptional 11.7% |
| Immigrants | Korea | 99.6 /100 | #28 | Exceptional 11.7% |
| Immigrants | North Macedonia | 99.6 /100 | #29 | Exceptional 11.7% |
| Greeks | 99.5 /100 | #30 | Exceptional 11.7% |
| Poles | 99.5 /100 | #31 | Exceptional 11.7% |
| Danes | 99.5 /100 | #32 | Exceptional 11.7% |
| Cypriots | 99.5 /100 | #33 | Exceptional 11.8% |
| Immigrants | Singapore | 99.4 /100 | #34 | Exceptional 11.8% |
| Immigrants | Iran | 99.4 /100 | #35 | Exceptional 11.8% |