Canadian vs Immigrants from Western Asia Female Poverty

COMPARE

Canadian
Race
Ancestry
AfghanAfricanAlaska NativeAlaskan AthabascanAlbanianAleutAlsatianAmericanApacheArabArapahoArgentineanArmenianAssyrian/Chaldean/SyriacAustralianAustrianBahamianBangladeshiBarbadianBasqueBelgianBelizeanBermudanBhutaneseBlackfeetBolivianBrazilianBritishBritish West IndianBulgarianBurmeseCajunCambodianCanadianCape VerdeanCarpatho RusynCelticCentral AmericanCentral American IndianCherokeeCheyenneChickasawChileanChineseChippewaChoctawColombianColvilleComancheCosta RicanCreeCreekCroatianCrowCubanCypriotCzechCzechoslovakianDanishDelawareDominicanDutchDutch West IndianEastern EuropeanEcuadorianEgyptianEnglishEstonianEthiopianEuropeanFijianFilipinoFinnishFrenchFrench American IndianFrench CanadianGermanGerman RussianGhanaianGreekGuamanian/ChamorroGuatemalanGuyaneseHaitianHmongHonduranHopiHoumaHungarianIcelanderIndian (Asian)IndonesianInupiatIranianIraqiIrishIroquoisIsraeliItalianJamaicanJapaneseJordanianKenyanKiowaKoreanLaotianLatvianLebaneseLiberianLithuanianLumbeeLuxembourgerMacedonianMalaysianMalteseMarshalleseMenomineeMexicanMexican American IndianMongolianMoroccanNative HawaiianNavajoNepaleseNew ZealanderNicaraguanNigerianNorthern EuropeanNorwegianOkinawanOsageOttawaPaiutePakistaniPalestinianPanamanianParaguayanPennsylvania GermanPeruvianPimaPolishPortuguesePotawatomiPuebloPuerto RicanPuget Sound SalishRomanianRussianSalvadoranSamoanScandinavianScotch-IrishScottishSeminoleSenegaleseSerbianShoshoneSierra LeoneanSiouxSlavicSlovakSloveneSomaliSouth AfricanSouth AmericanSouth American IndianSoviet UnionSpaniardSpanishSpanish AmericanSpanish American IndianSri LankanSubsaharan AfricanSudaneseSwedishSwissSyrianTaiwaneseThaiTlingit-HaidaTohono O'OdhamTonganTrinidadian and TobagonianTsimshianTurkishU.S. Virgin IslanderUgandanUkrainianUruguayanUteVenezuelanVietnameseWelshWest IndianYakamaYaquiYugoslavianYumanYup'ikZimbabwean
Immigration
NonimmigrantsImmigrantsAfghanistanAfricaAlbaniaArgentinaArmeniaAsiaAustraliaAustriaBahamasBangladeshBarbadosBelarusBelgiumBelizeBoliviaBosnia and HerzegovinaBrazilBulgariaBurma/MyanmarCabo VerdeCambodiaCameroonCanadaCaribbeanCentral AmericaChileChinaColombiaCongoCosta RicaCroatiaCubaCzechoslovakiaDenmarkDominicaDominican RepublicEastern AfricaEastern AsiaEastern EuropeEcuadorEgyptEl SalvadorEnglandEritreaEthiopiaEuropeFijiFranceGermanyGhanaGreeceGrenadaGuatemalaGuyanaHaitiHondurasHong KongHungaryIndiaIndonesiaIranIraqIrelandIsraelItalyJamaicaJapanJordanKazakhstanKenyaKoreaKuwaitLaosLatin AmericaLatviaLebanonLiberiaLithuaniaMalaysiaMexicoMicronesiaMiddle AfricaMoldovaMoroccoNepalNetherlandsNicaraguaNigeriaNorth AmericaNorth MacedoniaNorthern AfricaNorthern EuropeNorwayOceaniaPakistanPanamaPeruPhilippinesPolandPortugalRomaniaRussiaSaudi ArabiaScotlandSenegalSerbiaSierra LeoneSingaporeSomaliaSouth AfricaSouth AmericaSouth Central AsiaSouth Eastern AsiaSouthern EuropeSpainSri LankaSt. Vincent and the GrenadinesSudanSwedenSwitzerlandSyriaTaiwanThailandTrinidad and TobagoTurkeyUgandaUkraineUruguayUzbekistanVenezuelaVietnamWest IndiesWestern AfricaWestern EuropeYemenZaireZimbabweAzores
Immigrants from Western Asia
Race
Ancestry
AfghanAfricanAlaska NativeAlaskan AthabascanAlbanianAleutAlsatianAmericanApacheArabArapahoArgentineanArmenianAssyrian/Chaldean/SyriacAustralianAustrianBahamianBangladeshiBarbadianBasqueBelgianBelizeanBermudanBhutaneseBlackfeetBolivianBrazilianBritishBritish West IndianBulgarianBurmeseCajunCambodianCape VerdeanCarpatho RusynCelticCentral AmericanCentral American IndianCherokeeCheyenneChickasawChileanChineseChippewaChoctawColombianColvilleComancheCosta RicanCreeCreekCroatianCrowCubanCypriotCzechCzechoslovakianDanishDelawareDominicanDutchDutch West IndianEastern EuropeanEcuadorianEgyptianEnglishEstonianEthiopianEuropeanFijianFilipinoFinnishFrenchFrench American IndianFrench CanadianGermanGerman RussianGhanaianGreekGuamanian/ChamorroGuatemalanGuyaneseHaitianHmongHonduranHopiHoumaHungarianIcelanderIndian (Asian)IndonesianInupiatIranianIraqiIrishIroquoisIsraeliItalianJamaicanJapaneseJordanianKenyanKiowaKoreanLaotianLatvianLebaneseLiberianLithuanianLumbeeLuxembourgerMacedonianMalaysianMalteseMarshalleseMenomineeMexicanMexican American IndianMongolianMoroccanNative HawaiianNavajoNepaleseNew ZealanderNicaraguanNigerianNorthern EuropeanNorwegianOkinawanOsageOttawaPaiutePakistaniPalestinianPanamanianParaguayanPennsylvania GermanPeruvianPimaPolishPortuguesePotawatomiPuebloPuerto RicanPuget Sound SalishRomanianRussianSalvadoranSamoanScandinavianScotch-IrishScottishSeminoleSenegaleseSerbianShoshoneSierra LeoneanSiouxSlavicSlovakSloveneSomaliSouth AfricanSouth AmericanSouth American IndianSoviet UnionSpaniardSpanishSpanish AmericanSpanish American IndianSri LankanSubsaharan AfricanSudaneseSwedishSwissSyrianTaiwaneseThaiTlingit-HaidaTohono O'OdhamTonganTrinidadian and TobagonianTsimshianTurkishU.S. Virgin IslanderUgandanUkrainianUruguayanUteVenezuelanVietnameseWelshWest IndianYakamaYaquiYugoslavianYumanYup'ikZimbabwean
Immigration
NonimmigrantsImmigrantsAfghanistanAfricaAlbaniaArgentinaArmeniaAsiaAustraliaAustriaBahamasBangladeshBarbadosBelarusBelgiumBelizeBoliviaBosnia and HerzegovinaBrazilBulgariaBurma/MyanmarCabo VerdeCambodiaCameroonCanadaCaribbeanCentral AmericaChileChinaColombiaCongoCosta RicaCroatiaCubaCzechoslovakiaDenmarkDominicaDominican RepublicEastern AfricaEastern AsiaEastern EuropeEcuadorEgyptEl SalvadorEnglandEritreaEthiopiaEuropeFijiFranceGermanyGhanaGreeceGrenadaGuatemalaGuyanaHaitiHondurasHong KongHungaryIndiaIndonesiaIranIraqIrelandIsraelItalyJamaicaJapanJordanKazakhstanKenyaKoreaKuwaitLaosLatin AmericaLatviaLebanonLiberiaLithuaniaMalaysiaMexicoMicronesiaMiddle AfricaMoldovaMoroccoNepalNetherlandsNicaraguaNigeriaNorth AmericaNorth MacedoniaNorthern AfricaNorthern EuropeNorwayOceaniaPakistanPanamaPeruPhilippinesPolandPortugalRomaniaRussiaSaudi ArabiaScotlandSenegalSerbiaSierra LeoneSingaporeSomaliaSouth AfricaSouth AmericaSouth Central AsiaSouth Eastern AsiaSouthern EuropeSpainSri LankaSt. Vincent and the GrenadinesSudanSwedenSwitzerlandSyriaTaiwanThailandTrinidad and TobagoTurkeyUgandaUkraineUruguayUzbekistanVenezuelaVietnamWest IndiesWestern AfricaWestern AsiaWestern EuropeYemenZaireZimbabweAzores
Female Poverty
Income
Poverty
Unemployment
Labor Participation
Family Structure
Vehicle Availability
Education Level
Disability

Female Poverty Comparison

Canadians

Immigrants from Western Asia

Exceptional
Fair
12.7%
FEMALE POVERTY
92.0/ 100
METRIC RATING
113th/ 347
METRIC RANK
13.9%
FEMALE POVERTY
20.7/ 100
METRIC RATING
203rd/ 347
METRIC RANK

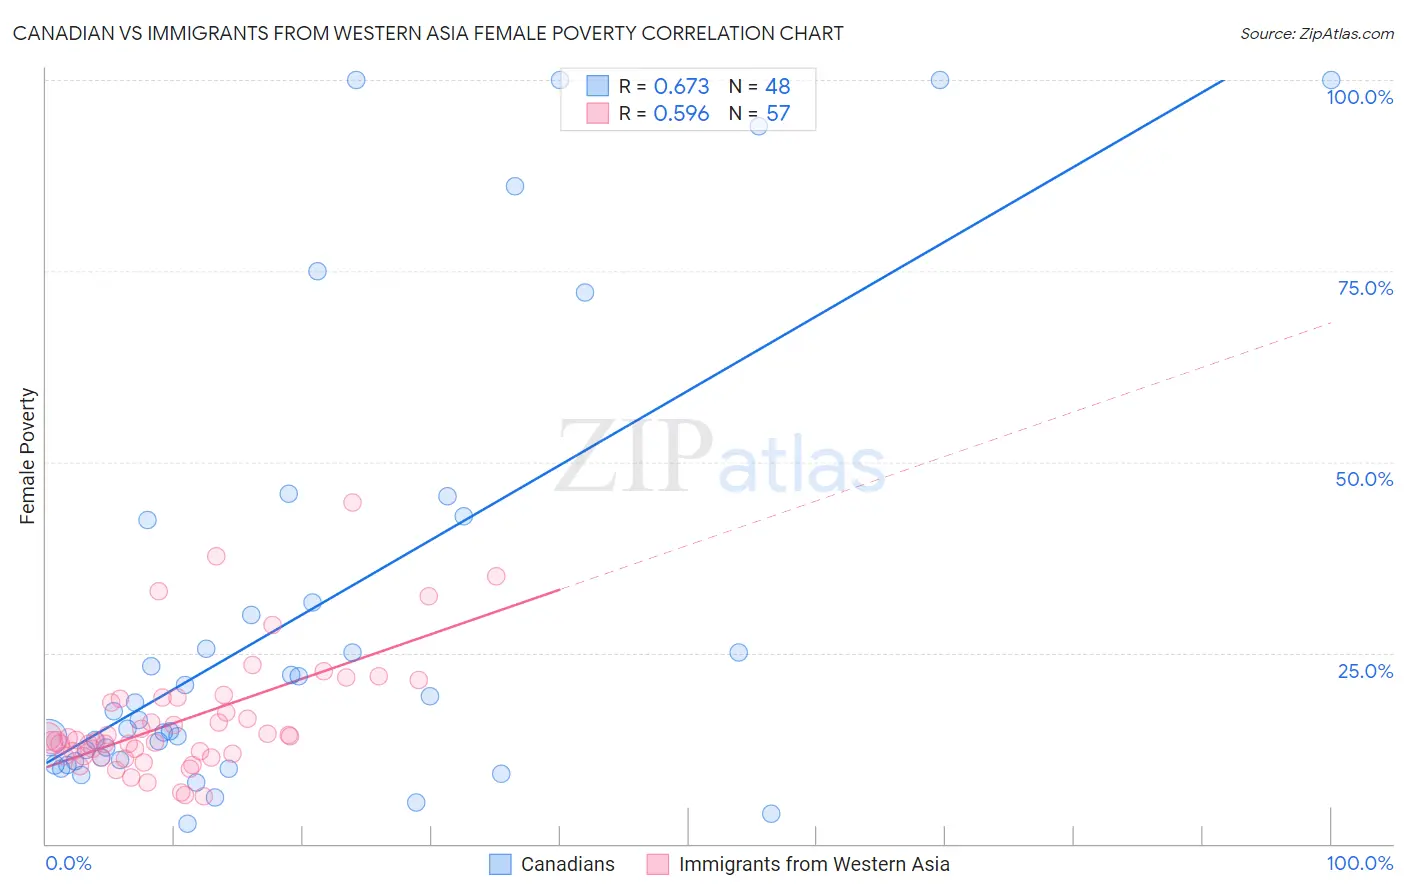
Canadian vs Immigrants from Western Asia Female Poverty Correlation Chart

The statistical analysis conducted on geographies consisting of 437,154,651 people shows a significant positive correlation between the proportion of Canadians and poverty level among females in the United States with a correlation coefficient (R) of 0.673 and weighted average of 12.7%. Similarly, the statistical analysis conducted on geographies consisting of 404,121,163 people shows a substantial positive correlation between the proportion of Immigrants from Western Asia and poverty level among females in the United States with a correlation coefficient (R) of 0.596 and weighted average of 13.9%, a difference of 9.7%.
Canadian vs Immigrants from Western Asia Female Poverty

Female Poverty Correlation Summary

MeasurementCanadianImmigrants from Western Asia
Minimum2.7%6.3%
Maximum100.0%44.7%
Range97.3%38.4%
Mean30.0%16.2%
Median16.8%13.5%
Interquartile 25% (IQ1)10.9%11.5%
Interquartile 75% (IQ3)37.0%19.0%
Interquartile Range (IQR)26.0%7.6%
Standard Deviation (Sample)29.7%7.8%
Standard Deviation (Population)29.4%7.8%

Similar Demographics by Female Poverty

Demographics Similar to Canadians by Female Poverty

In terms of female poverty, the demographic groups most similar to Canadians are Immigrants from Israel (12.6%, a difference of 0.030%), Welsh (12.7%, a difference of 0.12%), Puget Sound Salish (12.7%, a difference of 0.14%), Soviet Union (12.6%, a difference of 0.17%), and Immigrants from Russia (12.7%, a difference of 0.26%).
DemographicsRating | RankFemale Poverty
Immigrants | Turkey
93.8
/100
|
#106
Exceptional
12.6%
Laotians
93.4
/100
|
#107
Exceptional
12.6%
Portuguese
93.1
/100
|
#108
Exceptional
12.6%
Immigrants | Zimbabwe
93.1
/100
|
#109
Exceptional
12.6%
Paraguayans
93.0
/100
|
#110
Exceptional
12.6%
Soviet Union
92.4
/100
|
#111
Exceptional
12.6%
Immigrants | Israel
92.0
/100
|
#112
Exceptional
12.6%
Canadians
92.0
/100
|
#113
Exceptional
12.7%
Welsh
91.6
/100
|
#114
Exceptional
12.7%
Puget Sound Salish
91.5
/100
|
#115
Exceptional
12.7%
Immigrants | Russia
91.2
/100
|
#116
Exceptional
12.7%
Immigrants | Southern Europe
90.9
/100
|
#117
Exceptional
12.7%
Sri Lankans
90.9
/100
|
#118
Exceptional
12.7%
Albanians
90.8
/100
|
#119
Exceptional
12.7%
New Zealanders
90.6
/100
|
#120
Exceptional
12.7%

Demographics Similar to Immigrants from Western Asia by Female Poverty

In terms of female poverty, the demographic groups most similar to Immigrants from Western Asia are Hmong (13.9%, a difference of 0.050%), Immigrants from Kenya (13.9%, a difference of 0.060%), Spanish (13.9%, a difference of 0.10%), Spaniard (13.9%, a difference of 0.27%), and Immigrants from Lebanon (13.8%, a difference of 0.65%).
DemographicsRating | RankFemale Poverty
South American Indians
28.9
/100
|
#196
Fair
13.7%
Arabs
28.6
/100
|
#197
Fair
13.7%
Immigrants | Uganda
28.5
/100
|
#198
Fair
13.7%
Immigrants | Lebanon
25.6
/100
|
#199
Fair
13.8%
Spanish
21.4
/100
|
#200
Fair
13.9%
Immigrants | Kenya
21.1
/100
|
#201
Fair
13.9%
Hmong
21.1
/100
|
#202
Fair
13.9%
Immigrants | Western Asia
20.7
/100
|
#203
Fair
13.9%
Spaniards
18.9
/100
|
#204
Poor
13.9%
Ugandans
15.4
/100
|
#205
Poor
14.0%
Immigrants | Uruguay
14.0
/100
|
#206
Poor
14.0%
Immigrants | Eastern Africa
9.0
/100
|
#207
Tragic
14.2%
Immigrants | Azores
7.9
/100
|
#208
Tragic
14.2%
Panamanians
7.7
/100
|
#209
Tragic
14.2%
Malaysians
7.4
/100
|
#210
Tragic
14.3%