Canadian vs Belgian Female Poverty
COMPARE
Canadian
Belgian
Female Poverty
Female Poverty Comparison
Canadians
Belgians
12.7%
FEMALE POVERTY
92.0/ 100
METRIC RATING
113th/ 347
METRIC RANK
12.4%
FEMALE POVERTY
95.8/ 100
METRIC RATING
91st/ 347
METRIC RANK
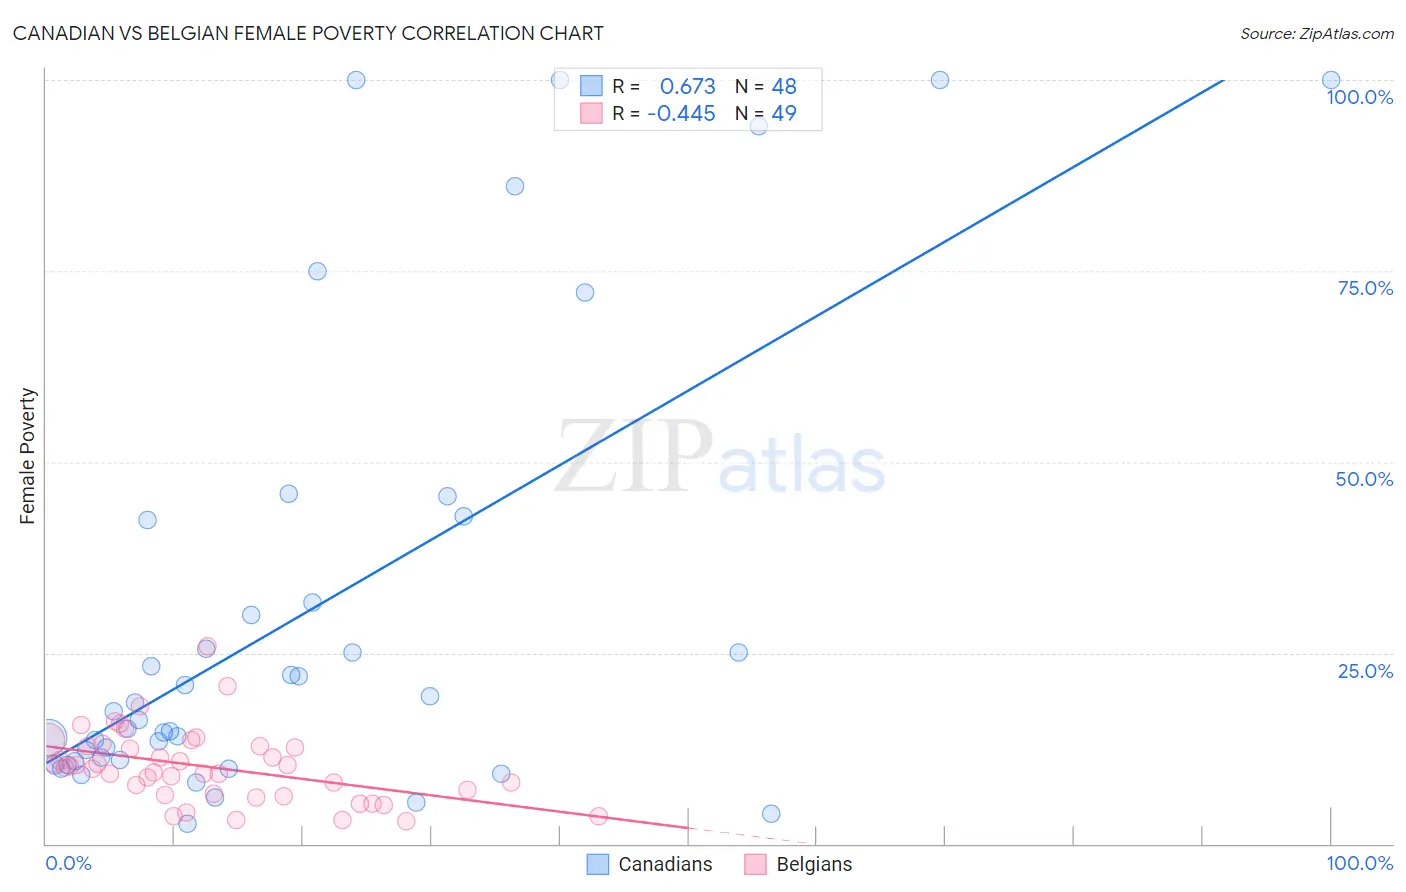
Canadian vs Belgian Female Poverty Correlation Chart
The statistical analysis conducted on geographies consisting of 437,154,651 people shows a significant positive correlation between the proportion of Canadians and poverty level among females in the United States with a correlation coefficient (R) of 0.673 and weighted average of 12.7%. Similarly, the statistical analysis conducted on geographies consisting of 355,775,724 people shows a moderate negative correlation between the proportion of Belgians and poverty level among females in the United States with a correlation coefficient (R) of -0.445 and weighted average of 12.4%, a difference of 1.8%.
Female Poverty Correlation Summary
| Measurement | Canadian | Belgian |
| Minimum | 2.7% | 2.9% |
| Maximum | 100.0% | 25.9% |
| Range | 97.3% | 23.0% |
| Mean | 30.0% | 10.1% |
| Median | 16.8% | 10.0% |
| Interquartile 25% (IQ1) | 10.9% | 6.4% |
| Interquartile 75% (IQ3) | 37.0% | 12.8% |
| Interquartile Range (IQR) | 26.0% | 6.3% |
| Standard Deviation (Sample) | 29.7% | 4.7% |
| Standard Deviation (Population) | 29.4% | 4.6% |
Similar Demographics by Female Poverty
Demographics Similar to Canadians by Female Poverty
In terms of female poverty, the demographic groups most similar to Canadians are Immigrants from Israel (12.6%, a difference of 0.030%), Welsh (12.7%, a difference of 0.12%), Puget Sound Salish (12.7%, a difference of 0.14%), Soviet Union (12.6%, a difference of 0.17%), and Immigrants from Russia (12.7%, a difference of 0.26%).
| Demographics | Rating | Rank | Female Poverty |
| Immigrants | Turkey | 93.8 /100 | #106 | Exceptional 12.6% |
| Laotians | 93.4 /100 | #107 | Exceptional 12.6% |
| Portuguese | 93.1 /100 | #108 | Exceptional 12.6% |
| Immigrants | Zimbabwe | 93.1 /100 | #109 | Exceptional 12.6% |
| Paraguayans | 93.0 /100 | #110 | Exceptional 12.6% |
| Soviet Union | 92.4 /100 | #111 | Exceptional 12.6% |
| Immigrants | Israel | 92.0 /100 | #112 | Exceptional 12.6% |
| Canadians | 92.0 /100 | #113 | Exceptional 12.7% |
| Welsh | 91.6 /100 | #114 | Exceptional 12.7% |
| Puget Sound Salish | 91.5 /100 | #115 | Exceptional 12.7% |
| Immigrants | Russia | 91.2 /100 | #116 | Exceptional 12.7% |
| Immigrants | Southern Europe | 90.9 /100 | #117 | Exceptional 12.7% |
| Sri Lankans | 90.9 /100 | #118 | Exceptional 12.7% |
| Albanians | 90.8 /100 | #119 | Exceptional 12.7% |
| New Zealanders | 90.6 /100 | #120 | Exceptional 12.7% |
Demographics Similar to Belgians by Female Poverty
In terms of female poverty, the demographic groups most similar to Belgians are Immigrants from Denmark (12.4%, a difference of 0.010%), Czechoslovakian (12.4%, a difference of 0.010%), Immigrants from Egypt (12.5%, a difference of 0.18%), Immigrants from Indonesia (12.5%, a difference of 0.21%), and English (12.4%, a difference of 0.23%).
| Demographics | Rating | Rank | Female Poverty |
| Northern Europeans | 96.6 /100 | #84 | Exceptional 12.4% |
| Irish | 96.5 /100 | #85 | Exceptional 12.4% |
| Dutch | 96.5 /100 | #86 | Exceptional 12.4% |
| Okinawans | 96.4 /100 | #87 | Exceptional 12.4% |
| Finns | 96.4 /100 | #88 | Exceptional 12.4% |
| English | 96.1 /100 | #89 | Exceptional 12.4% |
| Immigrants | Denmark | 95.8 /100 | #90 | Exceptional 12.4% |
| Belgians | 95.8 /100 | #91 | Exceptional 12.4% |
| Czechoslovakians | 95.7 /100 | #92 | Exceptional 12.4% |
| Immigrants | Egypt | 95.5 /100 | #93 | Exceptional 12.5% |
| Immigrants | Indonesia | 95.4 /100 | #94 | Exceptional 12.5% |
| Immigrants | South Africa | 95.4 /100 | #95 | Exceptional 12.5% |
| British | 95.2 /100 | #96 | Exceptional 12.5% |
| Australians | 95.2 /100 | #97 | Exceptional 12.5% |
| Native Hawaiians | 95.1 /100 | #98 | Exceptional 12.5% |