Canadian vs British West Indian Female Poverty
COMPARE
Canadian
British West Indian
Female Poverty
Female Poverty Comparison
Canadians
British West Indians
12.7%
FEMALE POVERTY
92.0/ 100
METRIC RATING
113th/ 347
METRIC RANK
17.0%
FEMALE POVERTY
0.0/ 100
METRIC RATING
313th/ 347
METRIC RANK
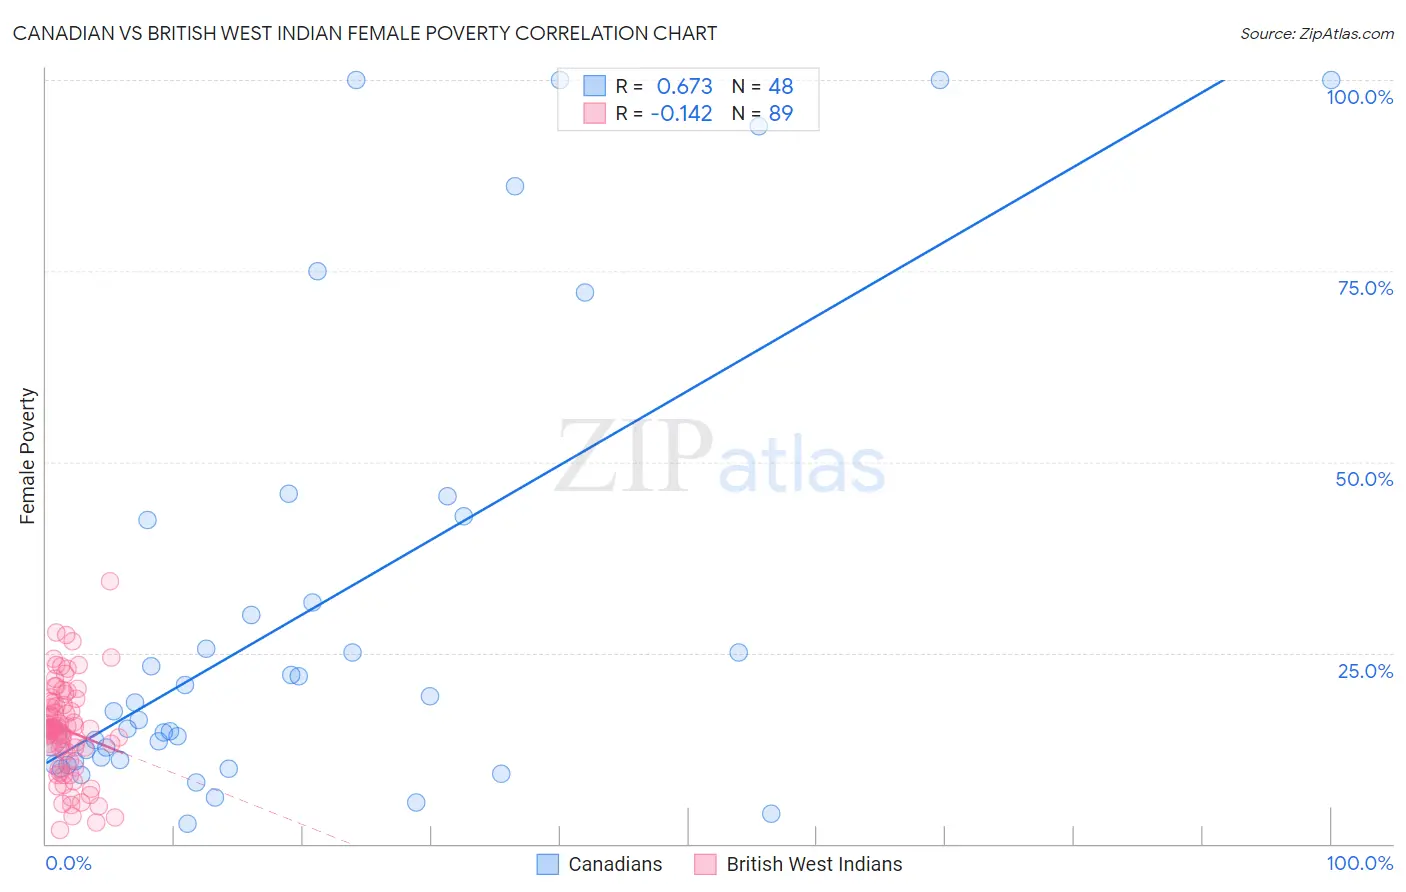
Canadian vs British West Indian Female Poverty Correlation Chart
The statistical analysis conducted on geographies consisting of 437,154,651 people shows a significant positive correlation between the proportion of Canadians and poverty level among females in the United States with a correlation coefficient (R) of 0.673 and weighted average of 12.7%. Similarly, the statistical analysis conducted on geographies consisting of 152,611,621 people shows a poor negative correlation between the proportion of British West Indians and poverty level among females in the United States with a correlation coefficient (R) of -0.142 and weighted average of 17.0%, a difference of 34.6%.
Female Poverty Correlation Summary
| Measurement | Canadian | British West Indian |
| Minimum | 2.7% | 1.8% |
| Maximum | 100.0% | 34.4% |
| Range | 97.3% | 32.6% |
| Mean | 30.0% | 14.9% |
| Median | 16.8% | 15.0% |
| Interquartile 25% (IQ1) | 10.9% | 12.1% |
| Interquartile 75% (IQ3) | 37.0% | 18.3% |
| Interquartile Range (IQR) | 26.0% | 6.2% |
| Standard Deviation (Sample) | 29.7% | 6.1% |
| Standard Deviation (Population) | 29.4% | 6.0% |
Similar Demographics by Female Poverty
Demographics Similar to Canadians by Female Poverty
In terms of female poverty, the demographic groups most similar to Canadians are Immigrants from Israel (12.6%, a difference of 0.030%), Welsh (12.7%, a difference of 0.12%), Puget Sound Salish (12.7%, a difference of 0.14%), Soviet Union (12.6%, a difference of 0.17%), and Immigrants from Russia (12.7%, a difference of 0.26%).
| Demographics | Rating | Rank | Female Poverty |
| Immigrants | Turkey | 93.8 /100 | #106 | Exceptional 12.6% |
| Laotians | 93.4 /100 | #107 | Exceptional 12.6% |
| Portuguese | 93.1 /100 | #108 | Exceptional 12.6% |
| Immigrants | Zimbabwe | 93.1 /100 | #109 | Exceptional 12.6% |
| Paraguayans | 93.0 /100 | #110 | Exceptional 12.6% |
| Soviet Union | 92.4 /100 | #111 | Exceptional 12.6% |
| Immigrants | Israel | 92.0 /100 | #112 | Exceptional 12.6% |
| Canadians | 92.0 /100 | #113 | Exceptional 12.7% |
| Welsh | 91.6 /100 | #114 | Exceptional 12.7% |
| Puget Sound Salish | 91.5 /100 | #115 | Exceptional 12.7% |
| Immigrants | Russia | 91.2 /100 | #116 | Exceptional 12.7% |
| Immigrants | Southern Europe | 90.9 /100 | #117 | Exceptional 12.7% |
| Sri Lankans | 90.9 /100 | #118 | Exceptional 12.7% |
| Albanians | 90.8 /100 | #119 | Exceptional 12.7% |
| New Zealanders | 90.6 /100 | #120 | Exceptional 12.7% |
Demographics Similar to British West Indians by Female Poverty
In terms of female poverty, the demographic groups most similar to British West Indians are Immigrants from Somalia (17.0%, a difference of 0.080%), Creek (17.0%, a difference of 0.17%), Immigrants from Guatemala (17.0%, a difference of 0.17%), Dutch West Indian (17.1%, a difference of 0.25%), and Immigrants from Mexico (17.0%, a difference of 0.41%).
| Demographics | Rating | Rank | Female Poverty |
| Immigrants | Caribbean | 0.0 /100 | #306 | Tragic 16.9% |
| Seminole | 0.0 /100 | #307 | Tragic 16.9% |
| Africans | 0.0 /100 | #308 | Tragic 16.9% |
| Immigrants | Mexico | 0.0 /100 | #309 | Tragic 17.0% |
| Creek | 0.0 /100 | #310 | Tragic 17.0% |
| Immigrants | Guatemala | 0.0 /100 | #311 | Tragic 17.0% |
| Immigrants | Somalia | 0.0 /100 | #312 | Tragic 17.0% |
| British West Indians | 0.0 /100 | #313 | Tragic 17.0% |
| Dutch West Indians | 0.0 /100 | #314 | Tragic 17.1% |
| U.S. Virgin Islanders | 0.0 /100 | #315 | Tragic 17.3% |
| Hondurans | 0.0 /100 | #316 | Tragic 17.4% |
| Immigrants | Congo | 0.0 /100 | #317 | Tragic 17.4% |
| Ute | 0.0 /100 | #318 | Tragic 17.5% |
| Cajuns | 0.0 /100 | #319 | Tragic 17.5% |
| Immigrants | Dominica | 0.0 /100 | #320 | Tragic 17.5% |