Canadian vs Immigrants from Korea Householder Income Ages 45 - 64 years
COMPARE
Canadian
Immigrants from Korea
Householder Income Ages 45 - 64 years
Householder Income Ages 45 - 64 years Comparison
Canadians
Immigrants from Korea
$104,560
HOUSEHOLDER INCOME AGES 45 - 64 YEARS
89.3/ 100
METRIC RATING
134th/ 347
METRIC RANK
$121,243
HOUSEHOLDER INCOME AGES 45 - 64 YEARS
100.0/ 100
METRIC RATING
18th/ 347
METRIC RANK
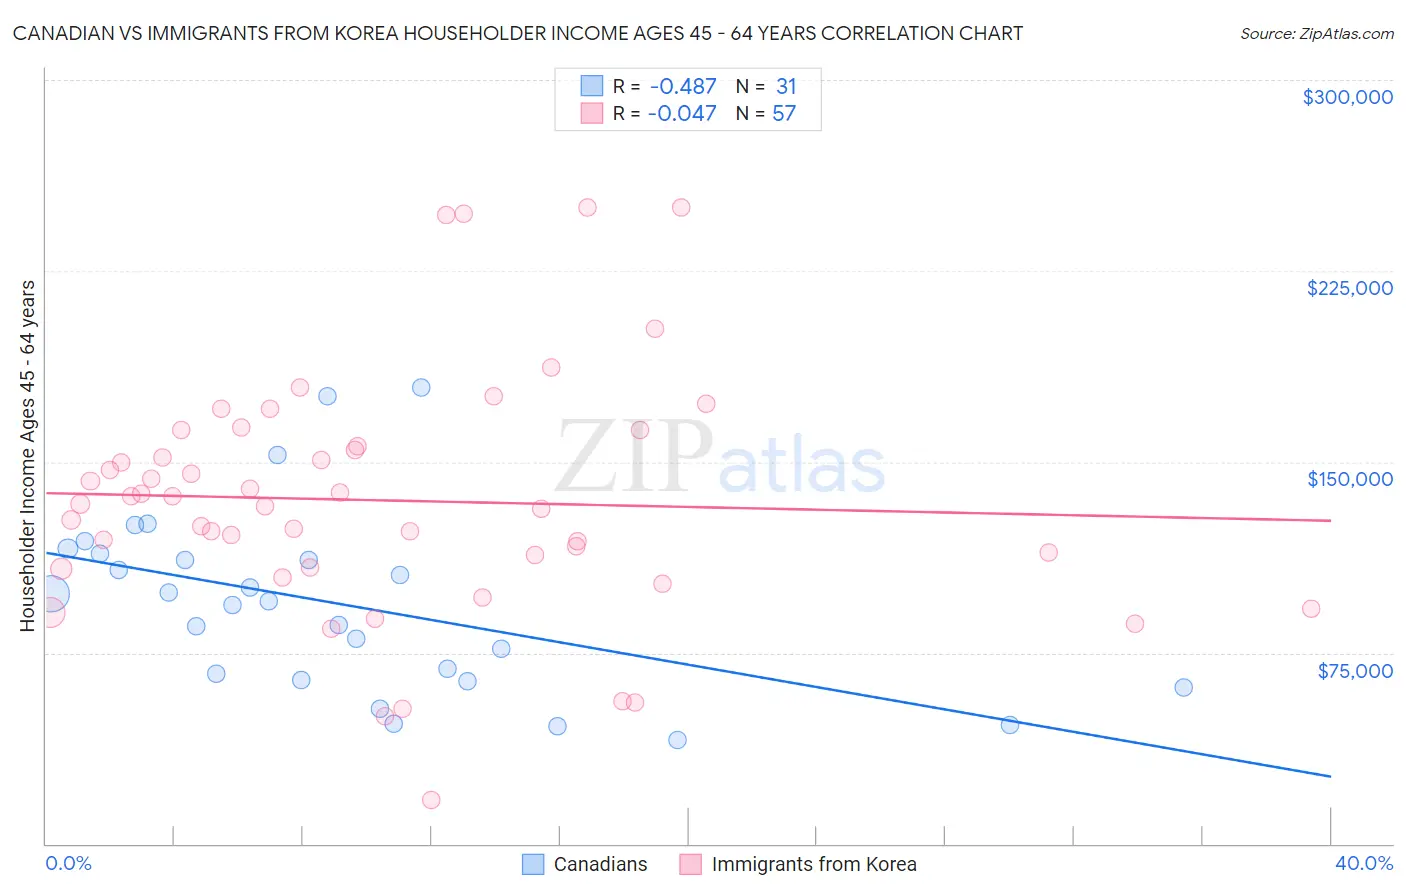
Canadian vs Immigrants from Korea Householder Income Ages 45 - 64 years Correlation Chart
The statistical analysis conducted on geographies consisting of 436,616,971 people shows a moderate negative correlation between the proportion of Canadians and household income with householder between the ages 45 and 64 in the United States with a correlation coefficient (R) of -0.487 and weighted average of $104,560. Similarly, the statistical analysis conducted on geographies consisting of 415,490,363 people shows no correlation between the proportion of Immigrants from Korea and household income with householder between the ages 45 and 64 in the United States with a correlation coefficient (R) of -0.047 and weighted average of $121,243, a difference of 16.0%.
Householder Income Ages 45 - 64 years Correlation Summary
| Measurement | Canadian | Immigrants from Korea |
| Minimum | $40,750 | $17,326 |
| Maximum | $178,981 | $250,001 |
| Range | $138,231 | $232,675 |
| Mean | $94,099 | $134,865 |
| Median | $95,411 | $133,392 |
| Interquartile 25% (IQ1) | $64,375 | $108,375 |
| Interquartile 75% (IQ3) | $113,872 | $159,271 |
| Interquartile Range (IQR) | $49,497 | $50,896 |
| Standard Deviation (Sample) | $35,584 | $48,086 |
| Standard Deviation (Population) | $35,005 | $47,662 |
Similar Demographics by Householder Income Ages 45 - 64 years
Demographics Similar to Canadians by Householder Income Ages 45 - 64 years
In terms of householder income ages 45 - 64 years, the demographic groups most similar to Canadians are Arab ($104,566, a difference of 0.010%), Brazilian ($104,408, a difference of 0.15%), Lebanese ($104,734, a difference of 0.17%), Immigrants from Syria ($104,858, a difference of 0.29%), and Taiwanese ($104,180, a difference of 0.36%).
| Demographics | Rating | Rank | Householder Income Ages 45 - 64 years |
| Immigrants | Saudi Arabia | 92.2 /100 | #127 | Exceptional $105,249 |
| Native Hawaiians | 91.8 /100 | #128 | Exceptional $105,149 |
| Peruvians | 91.5 /100 | #129 | Exceptional $105,070 |
| Immigrants | Zimbabwe | 91.2 /100 | #130 | Exceptional $104,992 |
| Immigrants | Syria | 90.7 /100 | #131 | Exceptional $104,858 |
| Lebanese | 90.1 /100 | #132 | Exceptional $104,734 |
| Arabs | 89.3 /100 | #133 | Excellent $104,566 |
| Canadians | 89.3 /100 | #134 | Excellent $104,560 |
| Brazilians | 88.6 /100 | #135 | Excellent $104,408 |
| Taiwanese | 87.4 /100 | #136 | Excellent $104,180 |
| Hungarians | 85.8 /100 | #137 | Excellent $103,913 |
| Ethiopians | 84.7 /100 | #138 | Excellent $103,736 |
| Immigrants | Oceania | 84.5 /100 | #139 | Excellent $103,705 |
| Norwegians | 84.3 /100 | #140 | Excellent $103,682 |
| Immigrants | Uganda | 83.7 /100 | #141 | Excellent $103,584 |
Demographics Similar to Immigrants from Korea by Householder Income Ages 45 - 64 years
In terms of householder income ages 45 - 64 years, the demographic groups most similar to Immigrants from Korea are Burmese ($121,444, a difference of 0.17%), Eastern European ($120,684, a difference of 0.46%), Immigrants from China ($122,178, a difference of 0.77%), Immigrants from Eastern Asia ($122,222, a difference of 0.81%), and Indian (Asian) ($122,343, a difference of 0.91%).
| Demographics | Rating | Rank | Householder Income Ages 45 - 64 years |
| Cypriots | 100.0 /100 | #11 | Exceptional $123,396 |
| Immigrants | Israel | 100.0 /100 | #12 | Exceptional $122,893 |
| Immigrants | Ireland | 100.0 /100 | #13 | Exceptional $122,757 |
| Indians (Asian) | 100.0 /100 | #14 | Exceptional $122,343 |
| Immigrants | Eastern Asia | 100.0 /100 | #15 | Exceptional $122,222 |
| Immigrants | China | 100.0 /100 | #16 | Exceptional $122,178 |
| Burmese | 100.0 /100 | #17 | Exceptional $121,444 |
| Immigrants | Korea | 100.0 /100 | #18 | Exceptional $121,243 |
| Eastern Europeans | 100.0 /100 | #19 | Exceptional $120,684 |
| Immigrants | Australia | 100.0 /100 | #20 | Exceptional $119,308 |
| Immigrants | Sri Lanka | 100.0 /100 | #21 | Exceptional $119,094 |
| Immigrants | Belgium | 100.0 /100 | #22 | Exceptional $118,932 |
| Bolivians | 100.0 /100 | #23 | Exceptional $118,871 |
| Immigrants | Japan | 100.0 /100 | #24 | Exceptional $118,498 |
| Asians | 100.0 /100 | #25 | Exceptional $118,426 |