Immigrants from Greece vs Belgian Female Poverty
COMPARE
Immigrants from Greece
Belgian
Female Poverty
Female Poverty Comparison
Immigrants from Greece
Belgians
11.8%
FEMALE POVERTY
99.3/ 100
METRIC RATING
37th/ 347
METRIC RANK
12.4%
FEMALE POVERTY
95.8/ 100
METRIC RATING
91st/ 347
METRIC RANK
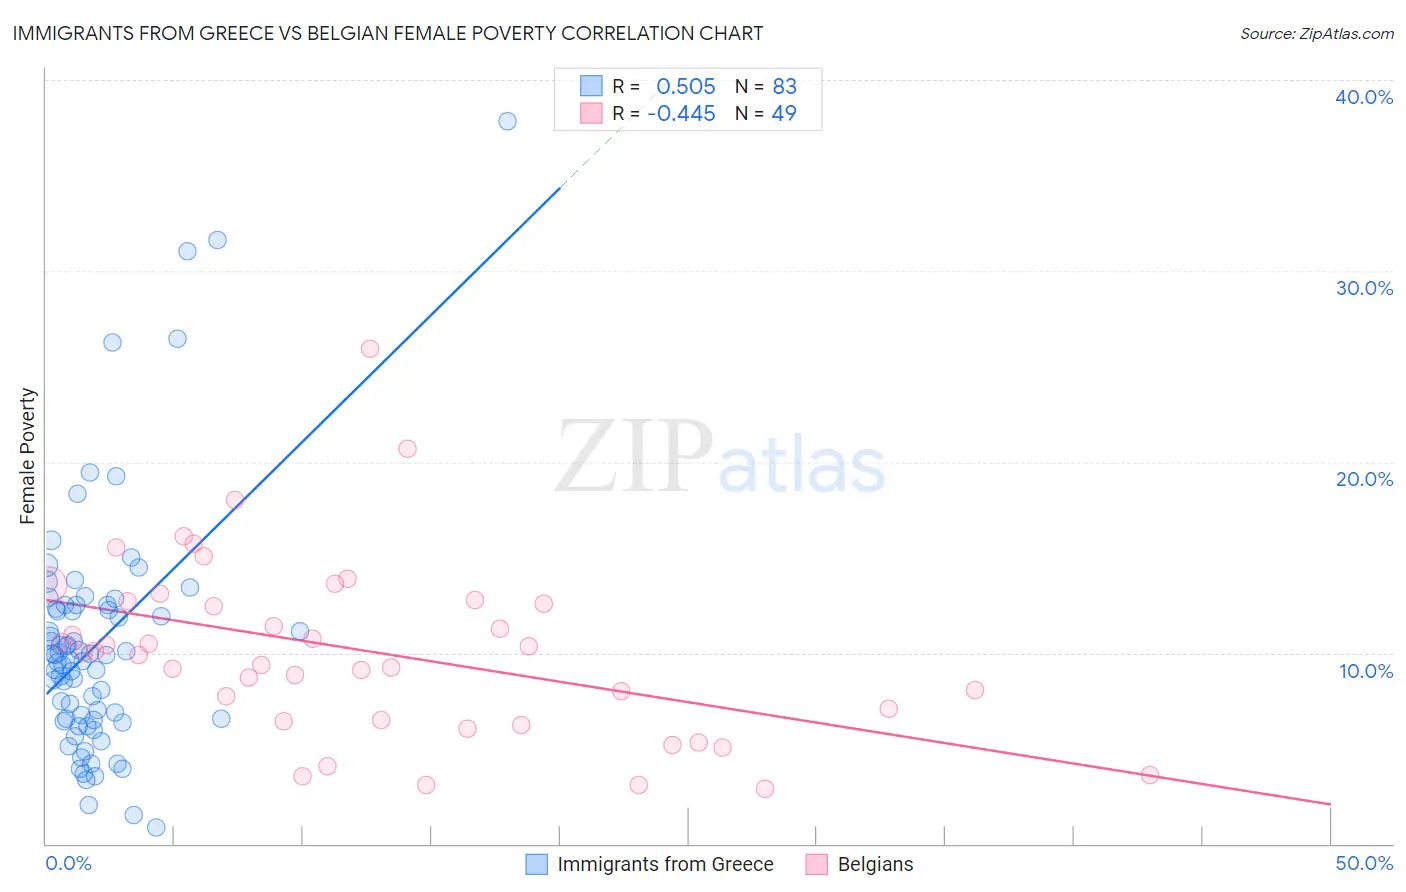
Immigrants from Greece vs Belgian Female Poverty Correlation Chart
The statistical analysis conducted on geographies consisting of 216,839,039 people shows a substantial positive correlation between the proportion of Immigrants from Greece and poverty level among females in the United States with a correlation coefficient (R) of 0.505 and weighted average of 11.8%. Similarly, the statistical analysis conducted on geographies consisting of 355,775,724 people shows a moderate negative correlation between the proportion of Belgians and poverty level among females in the United States with a correlation coefficient (R) of -0.445 and weighted average of 12.4%, a difference of 5.2%.
Female Poverty Correlation Summary
| Measurement | Immigrants from Greece | Belgian |
| Minimum | 0.85% | 2.9% |
| Maximum | 37.8% | 25.9% |
| Range | 37.0% | 23.0% |
| Mean | 10.5% | 10.1% |
| Median | 9.9% | 10.0% |
| Interquartile 25% (IQ1) | 6.5% | 6.4% |
| Interquartile 75% (IQ3) | 12.5% | 12.8% |
| Interquartile Range (IQR) | 6.0% | 6.3% |
| Standard Deviation (Sample) | 6.5% | 4.7% |
| Standard Deviation (Population) | 6.4% | 4.6% |
Similar Demographics by Female Poverty
Demographics Similar to Immigrants from Greece by Female Poverty
In terms of female poverty, the demographic groups most similar to Immigrants from Greece are Russian (11.8%, a difference of 0.020%), Immigrants from Pakistan (11.8%, a difference of 0.10%), Immigrants from Poland (11.8%, a difference of 0.22%), Immigrants from Iran (11.8%, a difference of 0.27%), and Macedonian (11.8%, a difference of 0.27%).
| Demographics | Rating | Rank | Female Poverty |
| Greeks | 99.5 /100 | #30 | Exceptional 11.7% |
| Poles | 99.5 /100 | #31 | Exceptional 11.7% |
| Danes | 99.5 /100 | #32 | Exceptional 11.7% |
| Cypriots | 99.5 /100 | #33 | Exceptional 11.8% |
| Immigrants | Singapore | 99.4 /100 | #34 | Exceptional 11.8% |
| Immigrants | Iran | 99.4 /100 | #35 | Exceptional 11.8% |
| Immigrants | Pakistan | 99.4 /100 | #36 | Exceptional 11.8% |
| Immigrants | Greece | 99.3 /100 | #37 | Exceptional 11.8% |
| Russians | 99.3 /100 | #38 | Exceptional 11.8% |
| Immigrants | Poland | 99.3 /100 | #39 | Exceptional 11.8% |
| Macedonians | 99.3 /100 | #40 | Exceptional 11.8% |
| Czechs | 99.2 /100 | #41 | Exceptional 11.9% |
| Immigrants | Moldova | 99.2 /100 | #42 | Exceptional 11.9% |
| Koreans | 99.2 /100 | #43 | Exceptional 11.9% |
| Tongans | 99.2 /100 | #44 | Exceptional 11.9% |
Demographics Similar to Belgians by Female Poverty
In terms of female poverty, the demographic groups most similar to Belgians are Immigrants from Denmark (12.4%, a difference of 0.010%), Czechoslovakian (12.4%, a difference of 0.010%), Immigrants from Egypt (12.5%, a difference of 0.18%), Immigrants from Indonesia (12.5%, a difference of 0.21%), and English (12.4%, a difference of 0.23%).
| Demographics | Rating | Rank | Female Poverty |
| Northern Europeans | 96.6 /100 | #84 | Exceptional 12.4% |
| Irish | 96.5 /100 | #85 | Exceptional 12.4% |
| Dutch | 96.5 /100 | #86 | Exceptional 12.4% |
| Okinawans | 96.4 /100 | #87 | Exceptional 12.4% |
| Finns | 96.4 /100 | #88 | Exceptional 12.4% |
| English | 96.1 /100 | #89 | Exceptional 12.4% |
| Immigrants | Denmark | 95.8 /100 | #90 | Exceptional 12.4% |
| Belgians | 95.8 /100 | #91 | Exceptional 12.4% |
| Czechoslovakians | 95.7 /100 | #92 | Exceptional 12.4% |
| Immigrants | Egypt | 95.5 /100 | #93 | Exceptional 12.5% |
| Immigrants | Indonesia | 95.4 /100 | #94 | Exceptional 12.5% |
| Immigrants | South Africa | 95.4 /100 | #95 | Exceptional 12.5% |
| British | 95.2 /100 | #96 | Exceptional 12.5% |
| Australians | 95.2 /100 | #97 | Exceptional 12.5% |
| Native Hawaiians | 95.1 /100 | #98 | Exceptional 12.5% |