Immigrants from Haiti vs Belgian Female Poverty
COMPARE
Immigrants from Haiti
Belgian
Female Poverty
Female Poverty Comparison
Immigrants from Haiti
Belgians
16.1%
FEMALE POVERTY
0.0/ 100
METRIC RATING
282nd/ 347
METRIC RANK
12.4%
FEMALE POVERTY
95.8/ 100
METRIC RATING
91st/ 347
METRIC RANK
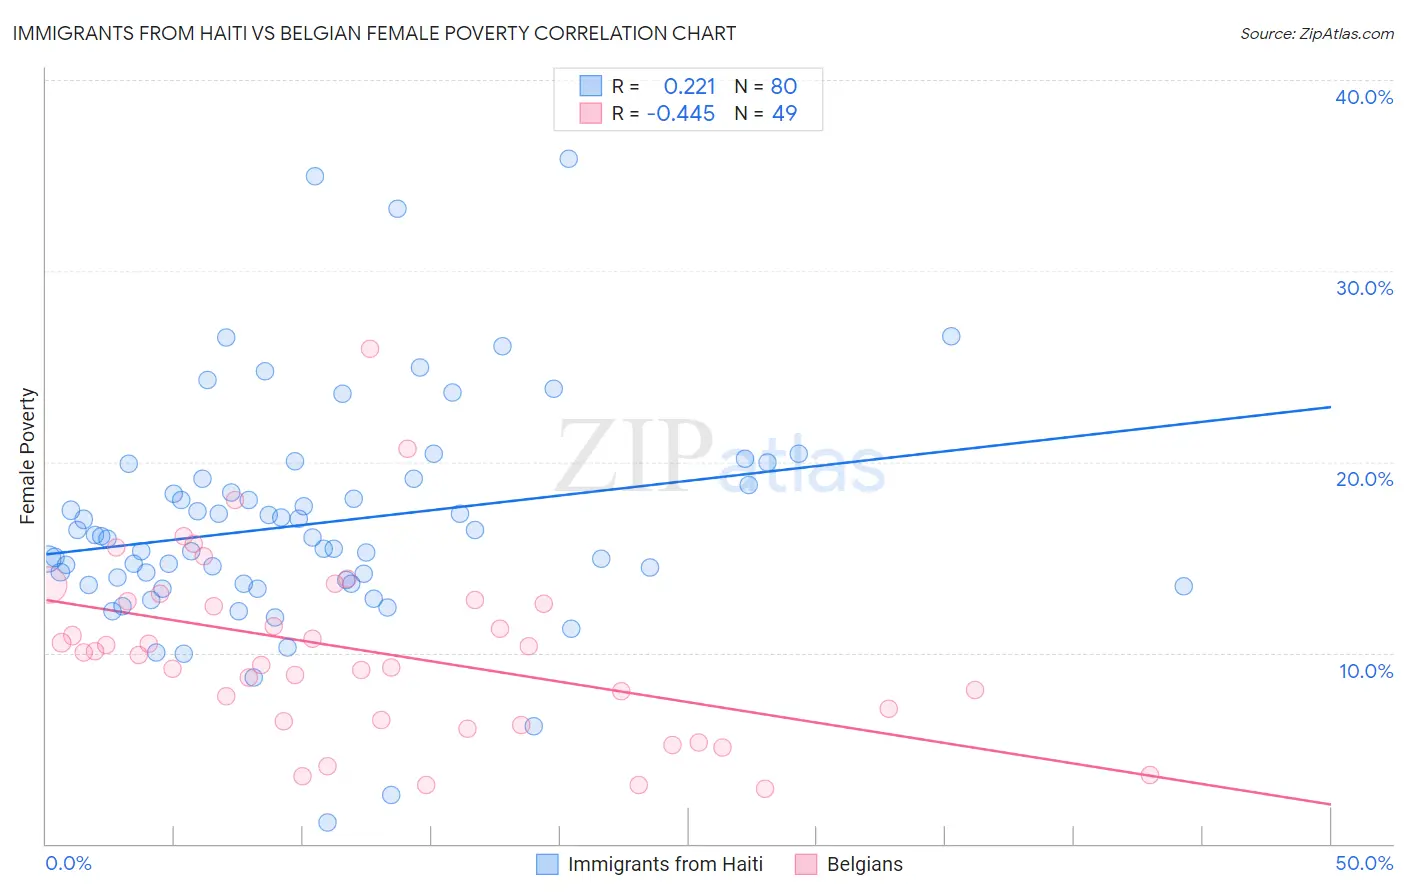
Immigrants from Haiti vs Belgian Female Poverty Correlation Chart
The statistical analysis conducted on geographies consisting of 225,156,546 people shows a weak positive correlation between the proportion of Immigrants from Haiti and poverty level among females in the United States with a correlation coefficient (R) of 0.221 and weighted average of 16.1%. Similarly, the statistical analysis conducted on geographies consisting of 355,775,724 people shows a moderate negative correlation between the proportion of Belgians and poverty level among females in the United States with a correlation coefficient (R) of -0.445 and weighted average of 12.4%, a difference of 29.8%.
Female Poverty Correlation Summary
| Measurement | Immigrants from Haiti | Belgian |
| Minimum | 1.1% | 2.9% |
| Maximum | 35.8% | 25.9% |
| Range | 34.7% | 23.0% |
| Mean | 16.8% | 10.1% |
| Median | 16.0% | 10.0% |
| Interquartile 25% (IQ1) | 13.6% | 6.4% |
| Interquartile 75% (IQ3) | 19.0% | 12.8% |
| Interquartile Range (IQR) | 5.3% | 6.3% |
| Standard Deviation (Sample) | 5.9% | 4.7% |
| Standard Deviation (Population) | 5.9% | 4.6% |
Similar Demographics by Female Poverty
Demographics Similar to Immigrants from Haiti by Female Poverty
In terms of female poverty, the demographic groups most similar to Immigrants from Haiti are Immigrants from Cuba (16.1%, a difference of 0.080%), Spanish American (16.2%, a difference of 0.13%), West Indian (16.1%, a difference of 0.15%), Vietnamese (16.1%, a difference of 0.17%), and Comanche (16.2%, a difference of 0.21%).
| Demographics | Rating | Rank | Female Poverty |
| Immigrants | Barbados | 0.0 /100 | #275 | Tragic 16.0% |
| Central Americans | 0.0 /100 | #276 | Tragic 16.0% |
| Bangladeshis | 0.0 /100 | #277 | Tragic 16.0% |
| Immigrants | West Indies | 0.0 /100 | #278 | Tragic 16.1% |
| Immigrants | Bahamas | 0.0 /100 | #279 | Tragic 16.1% |
| Vietnamese | 0.0 /100 | #280 | Tragic 16.1% |
| West Indians | 0.0 /100 | #281 | Tragic 16.1% |
| Immigrants | Haiti | 0.0 /100 | #282 | Tragic 16.1% |
| Immigrants | Cuba | 0.0 /100 | #283 | Tragic 16.1% |
| Spanish Americans | 0.0 /100 | #284 | Tragic 16.2% |
| Comanche | 0.0 /100 | #285 | Tragic 16.2% |
| Inupiat | 0.0 /100 | #286 | Tragic 16.2% |
| Immigrants | Belize | 0.0 /100 | #287 | Tragic 16.3% |
| Indonesians | 0.0 /100 | #288 | Tragic 16.4% |
| Blackfeet | 0.0 /100 | #289 | Tragic 16.4% |
Demographics Similar to Belgians by Female Poverty
In terms of female poverty, the demographic groups most similar to Belgians are Immigrants from Denmark (12.4%, a difference of 0.010%), Czechoslovakian (12.4%, a difference of 0.010%), Immigrants from Egypt (12.5%, a difference of 0.18%), Immigrants from Indonesia (12.5%, a difference of 0.21%), and English (12.4%, a difference of 0.23%).
| Demographics | Rating | Rank | Female Poverty |
| Northern Europeans | 96.6 /100 | #84 | Exceptional 12.4% |
| Irish | 96.5 /100 | #85 | Exceptional 12.4% |
| Dutch | 96.5 /100 | #86 | Exceptional 12.4% |
| Okinawans | 96.4 /100 | #87 | Exceptional 12.4% |
| Finns | 96.4 /100 | #88 | Exceptional 12.4% |
| English | 96.1 /100 | #89 | Exceptional 12.4% |
| Immigrants | Denmark | 95.8 /100 | #90 | Exceptional 12.4% |
| Belgians | 95.8 /100 | #91 | Exceptional 12.4% |
| Czechoslovakians | 95.7 /100 | #92 | Exceptional 12.4% |
| Immigrants | Egypt | 95.5 /100 | #93 | Exceptional 12.5% |
| Immigrants | Indonesia | 95.4 /100 | #94 | Exceptional 12.5% |
| Immigrants | South Africa | 95.4 /100 | #95 | Exceptional 12.5% |
| British | 95.2 /100 | #96 | Exceptional 12.5% |
| Australians | 95.2 /100 | #97 | Exceptional 12.5% |
| Native Hawaiians | 95.1 /100 | #98 | Exceptional 12.5% |